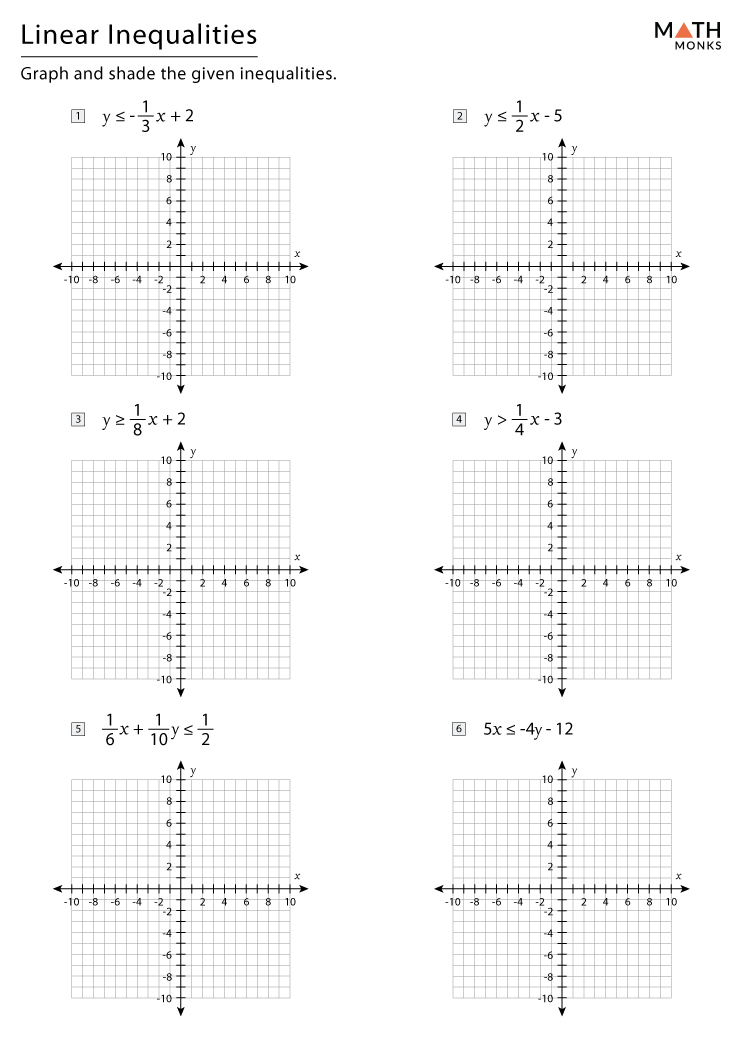
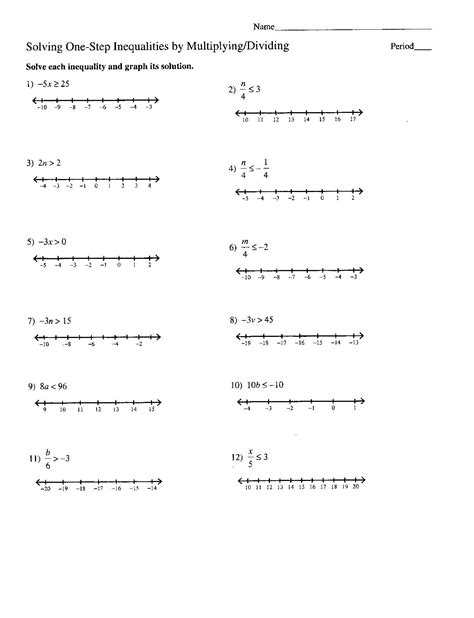
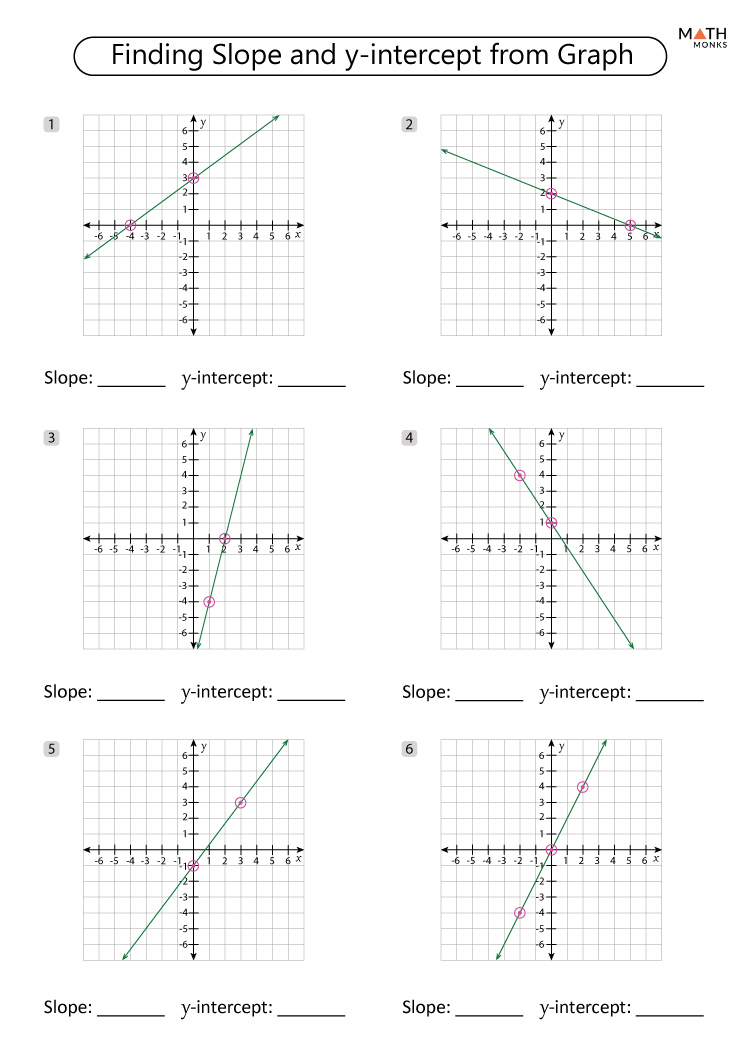
Graph Linear Inequalities: Fun Worksheet for Quick Mastery

Learning to graph linear inequalities is an essential skill for anyone studying algebra or preparing for higher-level math courses. This article aims to provide a fun and engaging worksheet focused on mastering the skill of graphing linear inequalities in two variables. Through a series of steps, visual aids, and practical examples, we'll explore how to graph inequalities efficiently and understand the underlying concepts.
What Are Linear Inequalities?

Linear inequalities are expressions where two linear expressions are compared with inequalities like < >, ≤, or ≥. Unlike equations, which have specific solutions, inequalities have a range of solutions represented by a shaded region on a coordinate plane.
How to Graph Linear Inequalities

To graph linear inequalities effectively, follow these steps:
- Write the inequality in slope-intercept form: Convert the inequality into the form y > mx + b , y < mx + b , y \geq mx + b , or y \leq mx + b .
- Graph the line: Plot the line y = mx + b using its slope m and y-intercept b . If the inequality includes ≤ or ≥, the line should be solid; otherwise, it should be dashed.
- Choose a test point: Select a point not on the line, like (0,0), to determine which side to shade. Substitute this point into the inequality.
- Shade the appropriate region: If the inequality holds true for the test point, shade the region on the side of the line that includes the point. If not, shade the opposite side.
- Check boundaries: For strict inequalities ( < or >), use dashed lines, for inclusive inequalities (≤ or ≥) use solid lines.
🔍 Note: When choosing a test point, pick an easy-to-substitute coordinate to avoid unnecessary calculations.
Fun Worksheet for Graphing Linear Inequalities

Here is an interactive worksheet with several inequalities to graph:
| Inequality | Graph |
|---|---|
| y > x + 1 |  |
| 2x - y ≤ 4 |  |
| x + 2y < 0 |  |
| y ≥ -x + 3 |  |

By practicing these examples, you'll develop a solid understanding of how to graph inequalities:
- The inequality y > x + 1 shows that we need to shade above a dashed line with a slope of 1 and a y-intercept of 1.
- For 2x - y ≤ 4 , we first convert it to y ≥ 2x - 4 and then graph the line y = 2x - 4 as solid since the inequality includes the line itself.
- The inequality x + 2y < 0 requires us to shade below the dashed line with a slope of - \frac{1}{2} passing through the origin.
- Lastly, y ≥ -x + 3 shows we need to shade above or include the solid line with a slope of -1 and a y-intercept of 3.
✏️ Note: Practice graphing without grids can also help in understanding how the lines interact in space, not just on a coordinate grid.
Further Learning

If you've enjoyed this worksheet, there are numerous resources available to enhance your understanding:
- Online graphing calculators for interactive practice.
- Software like Geogebra for advanced graphical analysis.
- Math apps tailored to algebra and inequality graphing.
Remember that practicing regularly with a variety of inequalities will refine your skills, allowing you to tackle more complex problems with ease.
Summary of Key Points

In summary, mastering the graphing of linear inequalities involves converting inequalities to slope-intercept form, plotting lines, choosing test points, and shading regions accordingly. The provided worksheet offers a practical approach to visualize and understand these concepts through repeated practice. Each step is crucial in understanding how different inequalities yield different regions on the coordinate plane. As you continue to practice, you'll not only become adept at graphing these inequalities but also enhance your ability to analyze and interpret mathematical problems involving inequalities.
Why do we use a solid line for certain inequalities?

+
A solid line is used when the inequality includes the boundary line (≤ or ≥), indicating that points on the line are part of the solution set.
Can you explain the role of the test point?

+
The test point helps determine which side of the line to shade by checking if it satisfies the inequality. If true, shade the side with the test point; if false, shade the opposite side.
What’s the significance of the slope in inequalities?

+
The slope determines the angle at which the line cuts through the coordinate plane. It affects which part of the plane is shaded, influencing the shape of the solution set.


