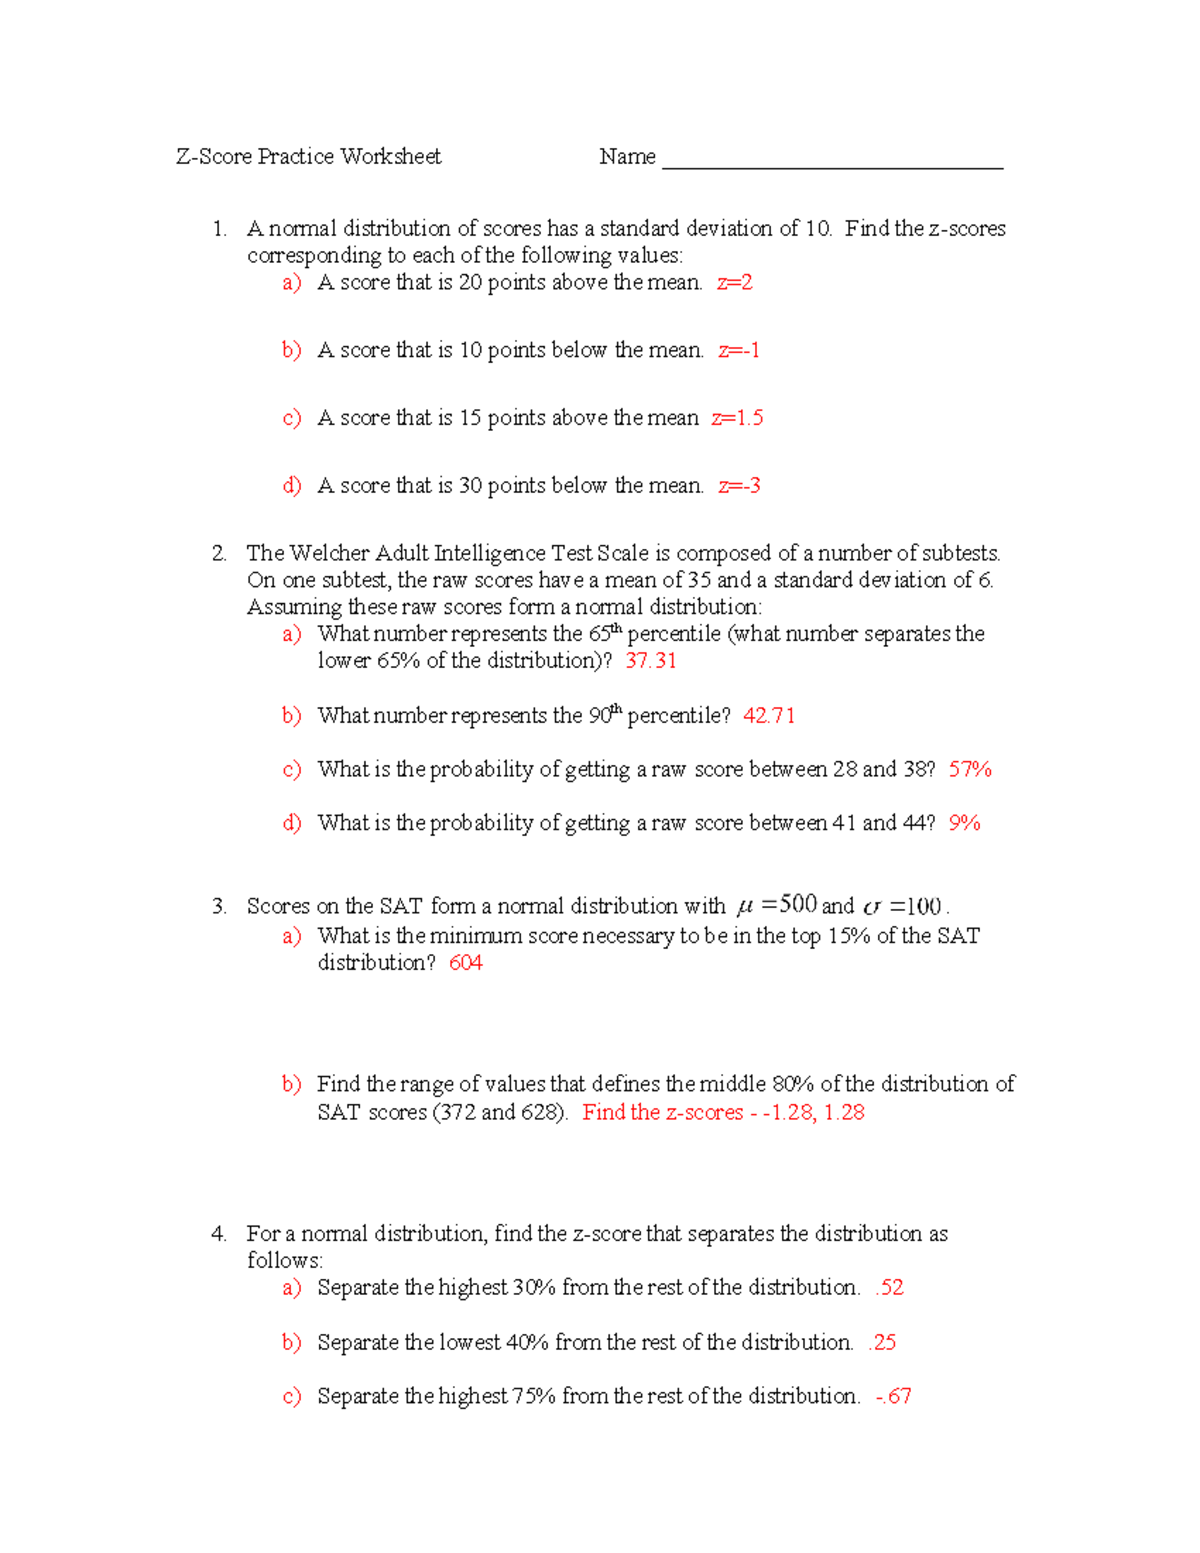
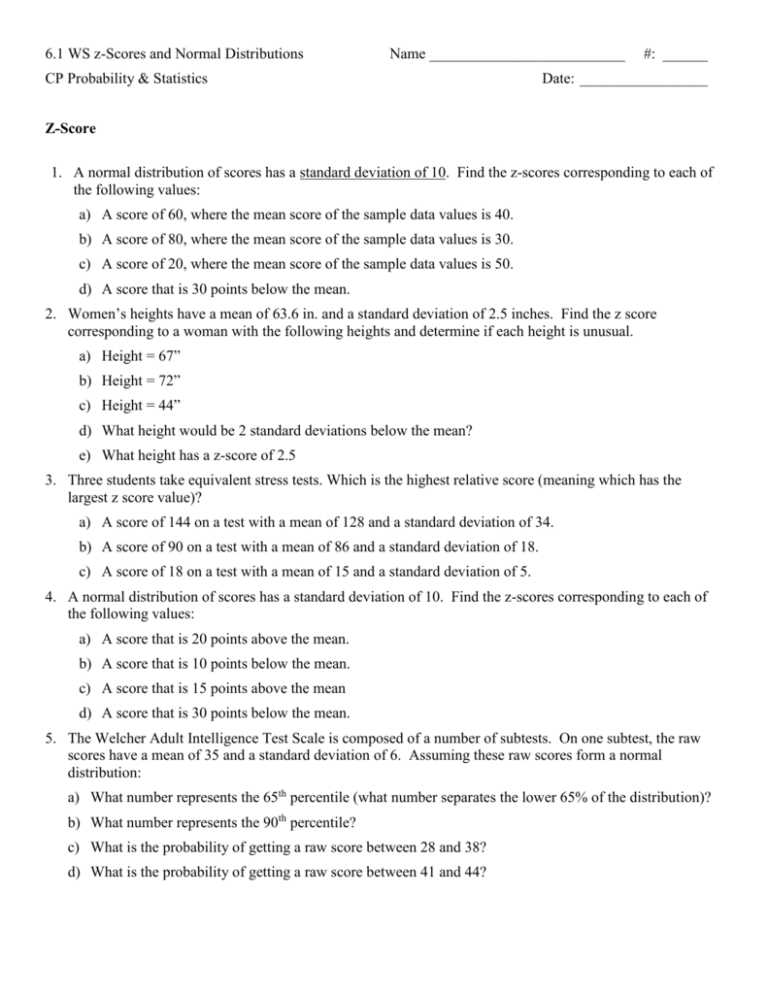
Z Score Practice: Worksheet for Mastery in Statistics

Statistics is a field that delves deep into numerical data analysis, and one of its foundational concepts is the Z-score. Understanding how to calculate and interpret a Z-score is crucial for students, researchers, and anyone involved in data analysis. In this blog post, we'll explore what Z-scores are, why they're important, and how you can practice calculating them to master this statistical tool.
What is a Z-Score?

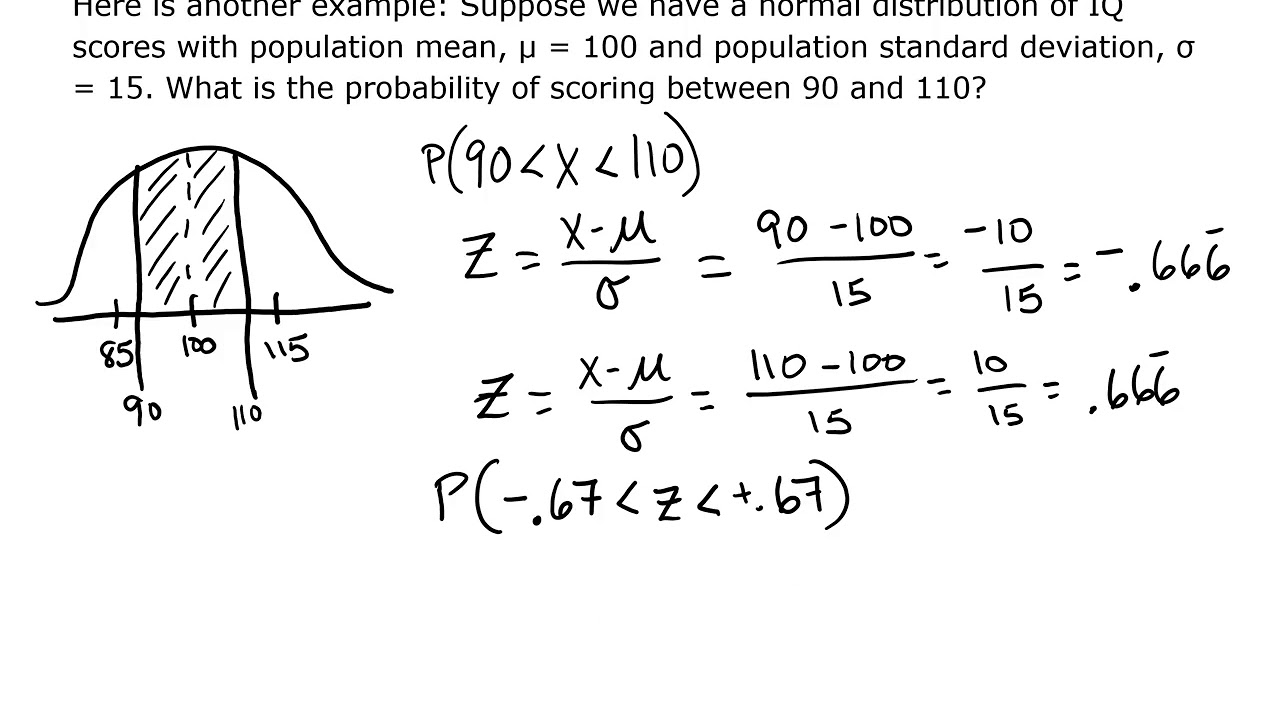
The Z-score (or standard score) represents how many standard deviations a data point is from the mean. Here’s the basic formula:
[ Z = \frac{(X - \mu)}{\sigma} ]
- X: The value of the element (a specific observation).
- μ: The mean of the dataset.
- σ: The standard deviation of the dataset.
By calculating a Z-score, you can assess where a value stands in relation to the population average, which helps in comparing different datasets or understanding outliers.

Why are Z-Scores Important?

Z-scores serve several critical purposes in statistical analysis:
- Standardization: They enable the comparison of scores from different distributions, which have varying means and standard deviations.
- Identification of Outliers: Extreme Z-scores indicate outliers that might skew results or need further investigation.
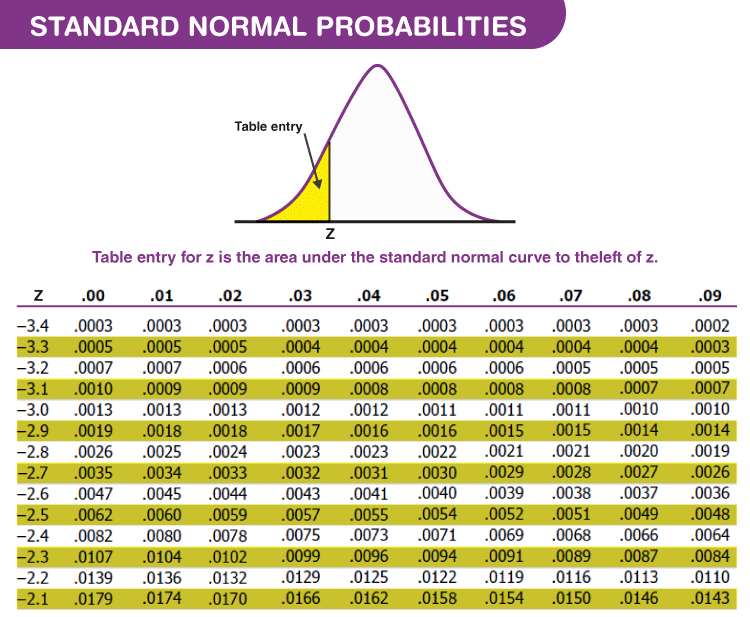
- Probability: Z-scores can be used to determine probabilities when the data follows a normal distribution.
Practicing Z-Scores: A Step-by-Step Guide

Let’s work through an example to practice calculating Z-scores:
Example Calculation

Consider a set of exam scores with the following details:
- Mean (μ) = 70
- Standard Deviation (σ) = 10
Now, let’s find the Z-score for a student who scored 85 on the exam.
[ Z = \frac{(85 - 70)}{10} = 1.5 ]
🧠 Note: A positive Z-score means the score is above the mean.
Interpretation

A Z-score of 1.5 indicates that the student’s score is 1.5 standard deviations above the mean. This student performed better than approximately 93.32% of the class (assuming normal distribution).
Practice Worksheet

| Score (X) | Mean (μ) | Standard Deviation (σ) | Z-Score |
|---|---|---|---|
| 60 | 70 | 10 | -1 |
| 80 | 70 | 10 | 1 |
| 95 | 70 | 10 | 2.5 |

Try calculating these scores on your own to reinforce your understanding of Z-scores.
Using Z-Scores in Real-World Scenarios

Here are some real-world applications where Z-scores are invaluable:
- Finance: To standardize returns across different assets.
- Quality Control: To monitor and control manufacturing processes.
- Psychometrics: For IQ scores or other standardized tests.
Through these applications, Z-scores help professionals make informed decisions by normalizing data from different sources or conditions.
Recap of Z-Scores

Mastering Z-scores is not just about memorizing a formula but understanding its implications for data analysis. They allow you to:
- Compare individual data points within or across different datasets.
- Identify how typical or unusual a value is.
- Predict probabilities and make statistical inferences.
In summary, Z-scores are a versatile tool in statistics, providing a way to normalize data, compare results, and highlight anomalies in a dataset. With practice, you’ll find that they become a fundamental part of your statistical toolkit.
What does a negative Z-score indicate?

+
A negative Z-score means that the data point is below the mean of the dataset. The further the score is from zero in the negative direction, the further below the mean the value lies.
Can Z-scores be applied to any distribution?

+
While Z-scores are most informative when the data follows a normal distribution, they can technically be calculated for any dataset. However, their interpretability and utility might vary if the data doesn’t follow a normal distribution.
How do you use Z-scores to identify outliers?

+
Outliers are typically considered as data points with Z-scores that are significantly outside the range of -3 to +3 in a normal distribution. However, this threshold can be adjusted based on the context of the analysis.


