Topographic Profile Worksheet: Mastering Elevation Analysis Easily

Topographic analysis plays a crucial role in various fields such as geography, geology, urban planning, and environmental science. Whether you are a student learning how to interpret maps, an urban planner designing a new park, or a hiker planning a route, understanding how to read and analyze topographic profiles is essential. In this comprehensive guide, we will explore how to create, interpret, and utilize topographic profile worksheets to master the art of elevation analysis, step by step.
What is a Topographic Profile?
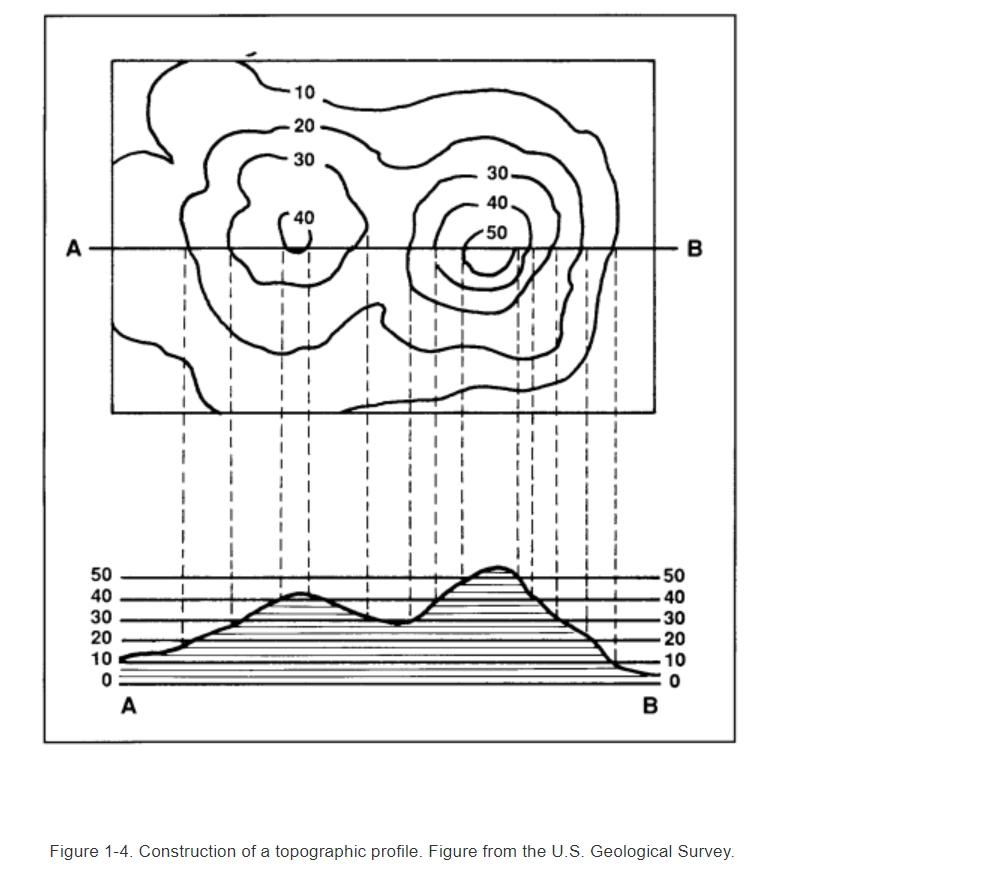
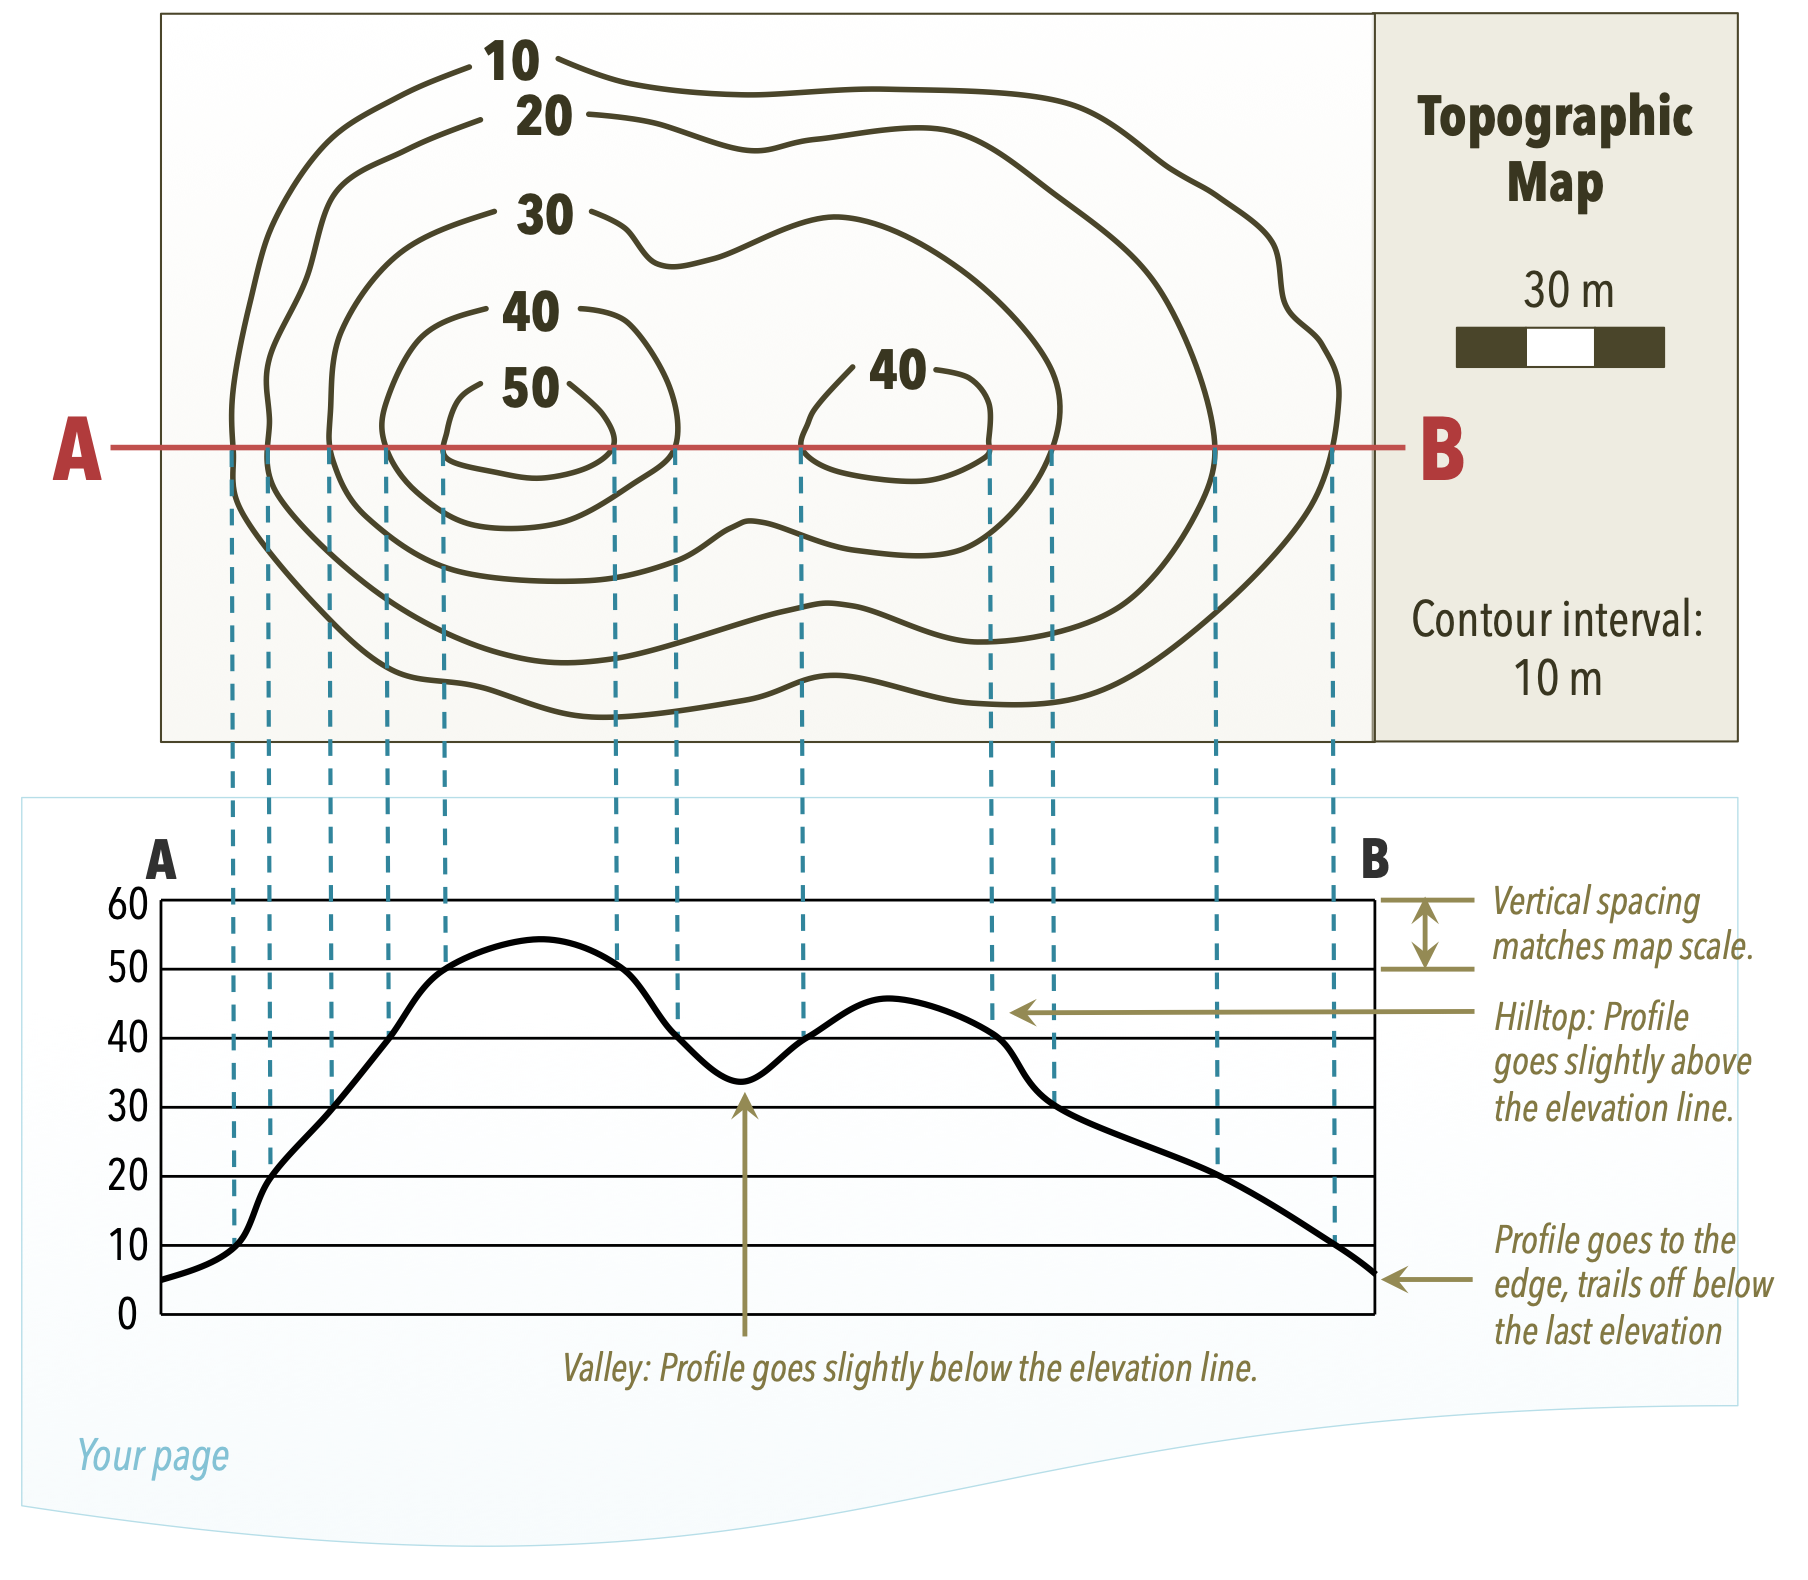
A topographic profile is a cross-sectional view of a portion of the Earth’s surface along a specific line or route. This profile shows how elevation changes across a landscape, providing a clear picture of rises, falls, valleys, hills, and mountains. Here are some key points:
- Usefulness: Helps in visualizing landforms, planning routes, assessing water flow, and analyzing land development potential.
- Components: Vertical axis for elevation, horizontal axis for distance along the selected route, and various symbols to represent points of interest.

Creating a Topographic Profile

Here’s how to create your own topographic profile:
Choose Your Route

Start by selecting the line or path along which you want to analyze the elevation change. This could be:
- A straight line across a map.
- A planned hiking or cycling route.
- An area of interest for geological study.
Gather Data

Collect elevation data along your selected line from topographic maps or digital elevation models (DEMs):
- Use map contour lines to estimate elevation at key points.
- Extract elevation data from DEMs or GPS points along the route.
Plotting the Profile
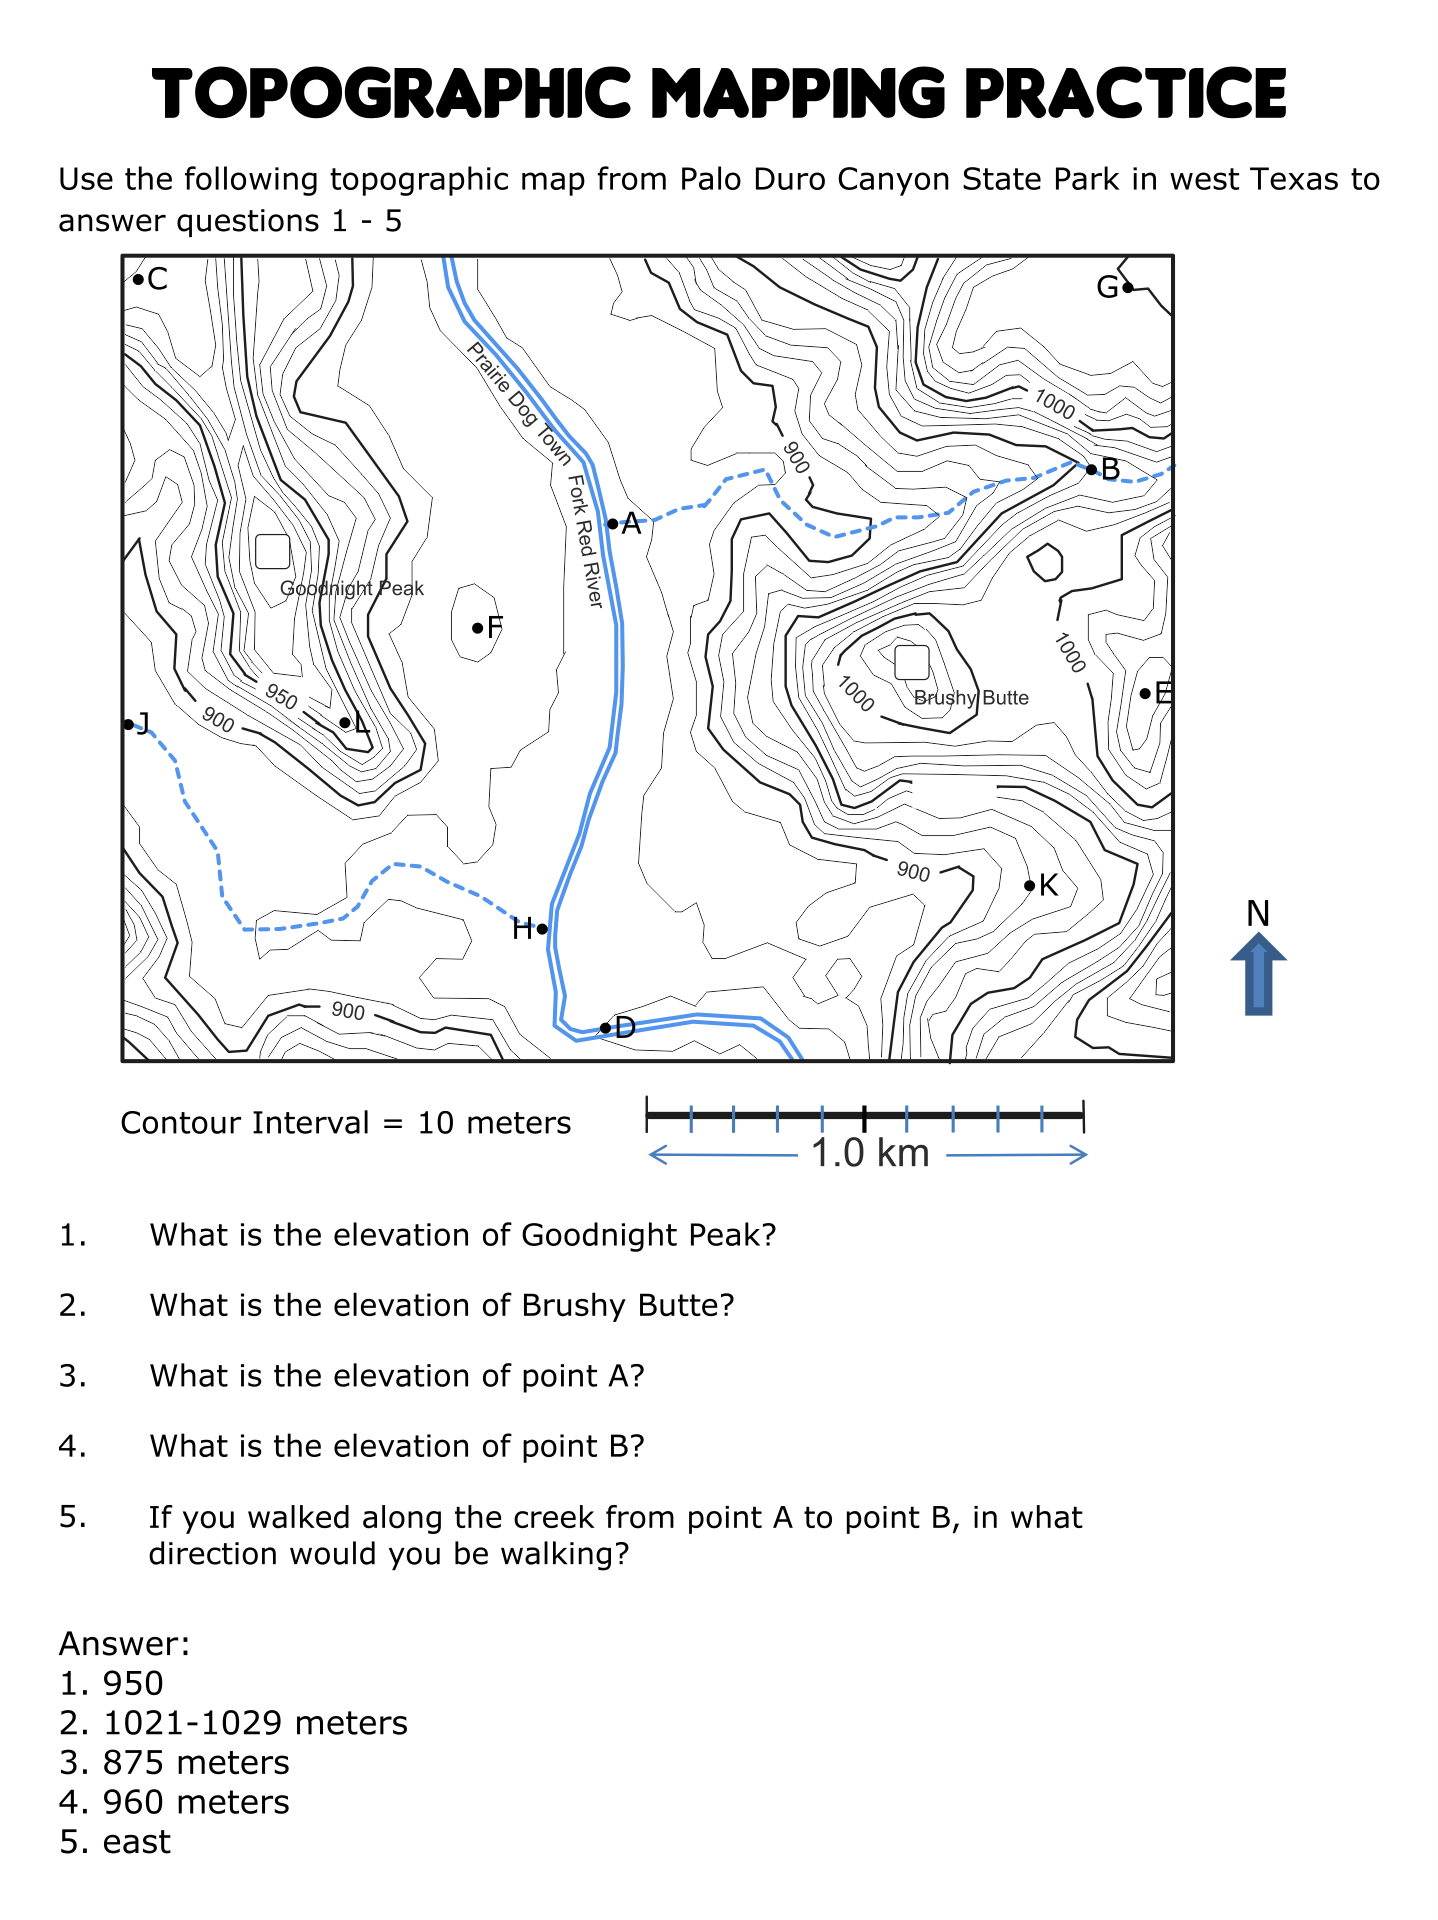
With data in hand:
- Set up graph paper with horizontal and vertical axes. The horizontal will represent distance, and the vertical will represent elevation.
- Mark the starting point of your route on the left side of the graph and proceed to plot each data point with distance and corresponding elevation.
- Connect these points to form a smooth curve or line, representing the elevation profile.
Software Tools for Creating Profiles

Manual plotting can be time-consuming. Here are some digital tools to expedite the process:
| Tool | Description |
|---|---|
| Google Earth Pro | Allows drawing paths to generate elevation profiles. |
| QGIS | Open-source GIS software with plugin for profile creation. |
| ArcGIS | Professional GIS software for advanced profile analysis. |

Interpreting Topographic Profiles

Once you have created your profile, interpretation is key:
Identify Landforms

Topographic profiles can reveal:
- Hills and Mountains: Peaks and high points in the profile.
- Valleys: Lower areas between peaks, often representing drainage basins.
- Cliffs: Steep, sudden changes in elevation.
- Plateaus: Flat areas at higher elevations.
📝 Note: Pay attention to the vertical exaggeration on your profile, as it can distort the true scale of slopes.
Analyze Slopes

The steepness of a slope on the profile indicates:
- Accessibility: Gradual slopes are easier to traverse or develop.
- Drainage: Steeper slopes can lead to rapid runoff, while gentle slopes might slow down water flow.
Understand Water Flow

Elevation changes help in understanding where water will flow and accumulate:
- Water Bodies: Lakes, rivers, and wetlands appear in lower elevations.
- Drainage Patterns: Profiles can show where streams or rivers might cut through the landscape.
Applications of Topographic Profiles

Topographic profiles have extensive practical applications:
In Education

- Helps students visualize and understand landscape features.
- Useful for learning about hydrology, geology, and ecology.
Urban Planning
- Inform decisions on building locations, road construction, and water management.
- Assess potential flood risks and natural hazards.
Environmental Studies

- Analyze habitat fragmentation or connectivity.
- Study climate change impacts on alpine zones or coastlines.
Summing Up

Topographic profile worksheets are more than just lines on a graph; they are tools for spatial analysis that reveal the secrets of the earth’s surface. By understanding how to create, interpret, and apply these profiles, you can make informed decisions about land use, planning, and exploration. This knowledge not only enriches your understanding of landscapes but also equips you to tackle challenges in diverse professional and personal endeavors where geography matters.
What is the purpose of vertical exaggeration in a topographic profile?
+Vertical exaggeration enhances subtle elevation changes to make them more noticeable. It’s useful for visualizing small relief features or landforms that might not be easily seen with natural proportions.
Can I create topographic profiles from satellite imagery?
+Yes, with tools like Google Earth Pro or specialized GIS software like ArcGIS, you can use satellite imagery to derive elevation data for profile creation.
How do I calculate the slope from a topographic profile?
+To calculate the slope, measure the vertical change (rise) and the horizontal distance (run). The slope is given by the formula: Slope = (Rise / Run) * 100%. Ensure to account for the profile’s scale when measuring distances.
What should I be cautious about when interpreting topographic profiles?
+Be aware of the exaggeration factor, which can mislead interpretations regarding the steepness of slopes. Also, remember that profiles are a two-dimensional simplification; real terrain can be much more complex.
