5 Ways to Master Mean, Median, Mode, and Range

Understanding and mastering key statistical measures like mean, median, mode, and range is crucial for data analysis across various fields, including education, economics, and science. These measures are fundamental in summarizing and interpreting data, allowing us to make informed decisions based on what the numbers are telling us. Here, we delve into five essential ways to master these concepts, ensuring you not only comprehend them but can apply them with confidence in real-world scenarios.
1. Grasp the Definitions

Before you can master these measures, you must understand what they are:
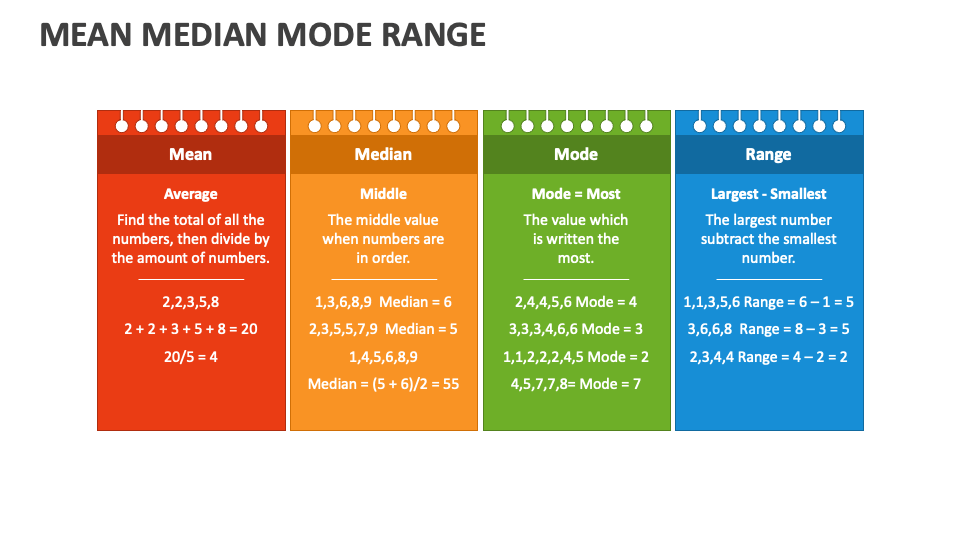
- Mean: This is the average value of a set of numbers. It’s calculated by summing all the values and then dividing by the number of values.
- Median: The middle value in a data set when ordered in ascending or descending order. If there’s an even number of observations, the median is the average of the two middle numbers.
- Mode: The value that appears most frequently in your data set. A dataset can have more than one mode (bimodal, trimodal) or none if no number repeats.
- Range: The difference between the highest and lowest values in a dataset, giving an idea of the spread of the data.
📘 Note: Understanding the underlying concepts is just the beginning; application is where mastery lies.
2. Practice with Real Data

Theoretical knowledge can only get you so far. Here’s how you can apply these concepts:
- Use datasets from your field of interest. For example, if you’re into environmental studies, look at air quality data or climate change statistics.
- Work with software like Excel, Python’s Pandas library, or R, which are fantastic tools for handling data.
- Example: Collect data on daily temperatures for a month, then calculate the mean temperature, median temperature, mode (if any), and the range to understand temperature variability.
3. Interactive Learning Tools

Interactive platforms and apps can turn learning into an engaging experience:
- Websites like Khan Academy or Desmos offer interactive statistical exercises where you can manipulate data to see how changes affect mean, median, mode, and range.
- Apps like GeoGebra provide dynamic visualizations, allowing you to see the effect of adding or removing data points on these measures.
4. Teach Others

Explaining concepts to others is a well-known method for reinforcing your own understanding:
- Offer to teach a tutorial session, or even start a study group where you can all learn together.
- Create content like video tutorials or blog posts to explain these measures using real-life examples or scenarios.
- This not only helps you clarify your understanding but also enhances your communication skills in discussing statistical concepts.
📚 Note: Teaching others forces you to organize your thoughts and uncover any gaps in your own understanding.
5. Understand Their Limitations and Applications

Every statistical measure has its strengths and limitations:
- The mean can be heavily influenced by outliers, making it less representative of the dataset in some cases.
- The median is robust against outliers but might not capture the distribution’s central tendency when there’s an odd number of observations.
- Mode is useful in categorical data or when dealing with nominal data but might not be effective with continuous numerical data.
- The range gives a simple measure of spread but ignores the central values, potentially misleading in skewed distributions.
Recognizing when to use which measure can help in choosing the right tool for data analysis and interpretation.
Mastering mean, median, mode, and range involves a blend of understanding, application, interaction, teaching, and critical thinking. By delving into the definitions, practicing with real data, engaging with interactive tools, teaching others, and understanding the limitations, you can build a robust foundation in statistical analysis. This knowledge is not just theoretical but practical, enabling you to analyze and interpret data effectively in various professional and academic settings.
What if my dataset has no mode?

+
Some datasets do not have a mode because no number appears more than once. In such cases, it might be more appropriate to report that the dataset has no mode or report the most frequent values if there’s more than one.
How do outliers affect the mean?

+
Outliers can significantly skew the mean. A single very high or very low value can pull the mean away from what might be considered typical for the rest of the data. This is why sometimes median is preferred when data contains outliers.
Can I use mean, median, and mode interchangeably?

+
No, each measure has its own purpose. Mean is used for average, median for middle value, and mode for the most frequent value. Depending on the nature of your data and what you want to convey, one might be more appropriate than the others.


