Calculate YoY Growth in Excel
Understanding Year-over-Year (YoY) Growth

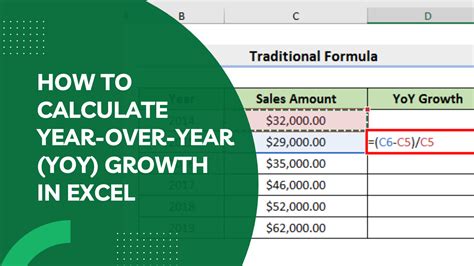
Year-over-Year (YoY) growth is a measure of how much something has changed from one year to the next. It’s commonly used in finance, economics, and business to assess the performance of investments, companies, or economies over time. Calculating YoY growth in Excel is straightforward and can be achieved using simple formulas.
Calculating YoY Growth in Excel
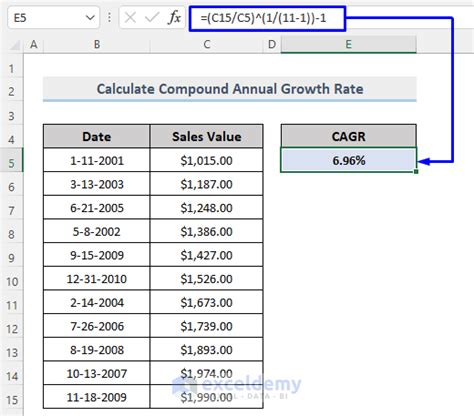
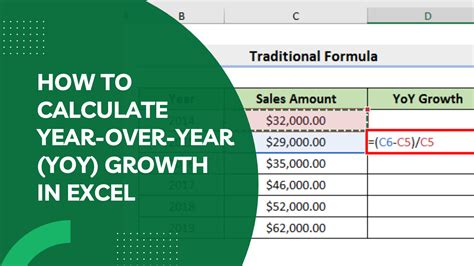
To calculate YoY growth in Excel, you need two pieces of data: the current year’s value and the previous year’s value. The formula for calculating YoY growth is:
(Current Year’s Value - Previous Year’s Value) / Previous Year’s Value
This formula can be represented in Excel as follows, assuming the current year’s value is in cell A2 and the previous year’s value is in cell A1:
= (A2 - A1) / A1
You can also express this as a percentage by multiplying by 100:
= ((A2 - A1) / A1) * 100
Example of Calculating YoY Growth
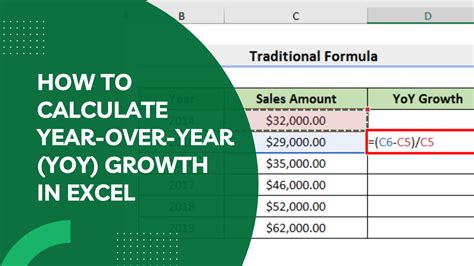
Let’s say you have the sales figures for two consecutive years: 100,000 in 2022 and 120,000 in 2023. To calculate the YoY growth, you would use the formula:
= ((120000 - 100000) / 100000) * 100
This calculation yields a 20% increase in sales from 2022 to 2023.
Using Excel to Calculate YoY Growth for Multiple Years

If you have data for multiple years and want to calculate the YoY growth for each year, you can use Excel’s formulas in a more dynamic way. Here’s how you can do it:
Enter Your Data: Start by entering your data into an Excel sheet. For example, if you have sales data for 2020, 2021, 2022, and 2023, you would enter these values into separate cells, let’s say A1 through A4.
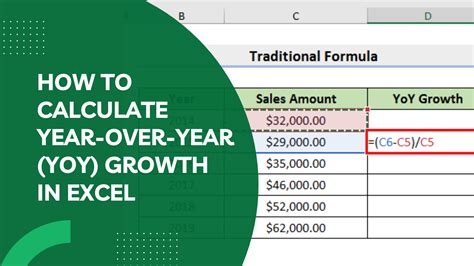
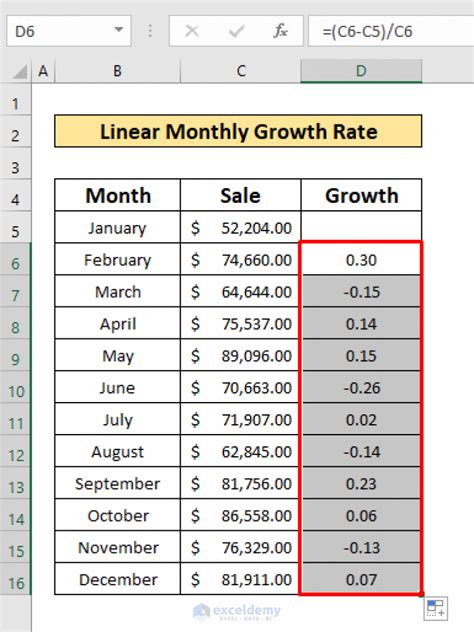
Apply the Formula: In a new cell, let’s say B2 (assuming A1 is the header and A2 is the first year’s data), you can apply the YoY growth formula. The formula, considering A2 as the current year and A1 as the previous year, would be:
= ((A2 - A1) / A1) * 100
- Drag the Formula Down: Once you’ve entered the formula, you can drag it down to apply it to the rest of your data. Excel will automatically adjust the formula to calculate the YoY growth for each subsequent year based on the values in the cells above and below.
Visualizing YoY Growth
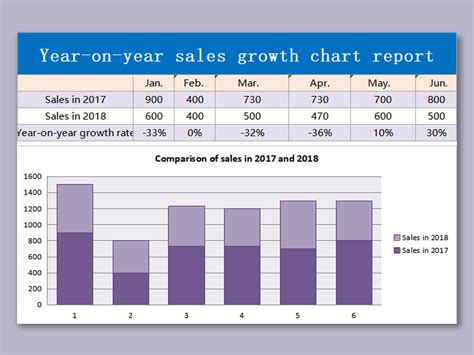
Visualizing your data can help in understanding trends and patterns. After calculating the YoY growth, you can create a chart in Excel to visualize the growth over the years.
Select Your Data: Select the range of cells that includes your years and their corresponding YoY growth percentages.
Insert a Chart: Go to the “Insert” tab in Excel, click on “Chart,” and select the type of chart you prefer (e.g., line chart, column chart).
Customize Your Chart: You can customize your chart by adding titles, labels, and changing colors to make it more informative and visually appealing.
Important Considerations
When calculating and interpreting YoY growth, keep the following points in mind:
- Negative Growth: If the result is negative, it indicates a decline rather than growth.
- Volatility: Large fluctuations in growth from one year to the next can indicate volatility or instability.
- Context: Always consider the context of your data. External factors like economic conditions, seasonal fluctuations, and one-time events can significantly impact YoY growth.
📊 Note: When working with real data, ensure that your calculations account for any missing values or outliers that could skew your results.
To summarize, calculating YoY growth in Excel is a straightforward process that involves simple subtraction and division. By applying this formula to your data, you can gain insights into how your values are changing over time, which is invaluable for making informed decisions in business and finance. Whether you’re analyzing sales figures, stock prices, or economic indicators, understanding YoY growth is a fundamental skill for anyone working with time-series data.
What is Year-over-Year (YoY) growth?
+
Year-over-Year (YoY) growth is a measure of how much something has changed from one year to the next, often used to assess performance of investments, companies, or economies.
How do I calculate YoY growth in Excel?
+
To calculate YoY growth in Excel, use the formula: ((Current Year’s Value - Previous Year’s Value) / Previous Year’s Value) * 100.
What are some common applications of YoY growth analysis?
+
YoY growth analysis is commonly used in finance, economics, and business to evaluate the performance of investments, companies, or economies over time, helping in decision-making and strategy development.


