H-R Diagram Worksheet: Simplify Stellar Classification Today

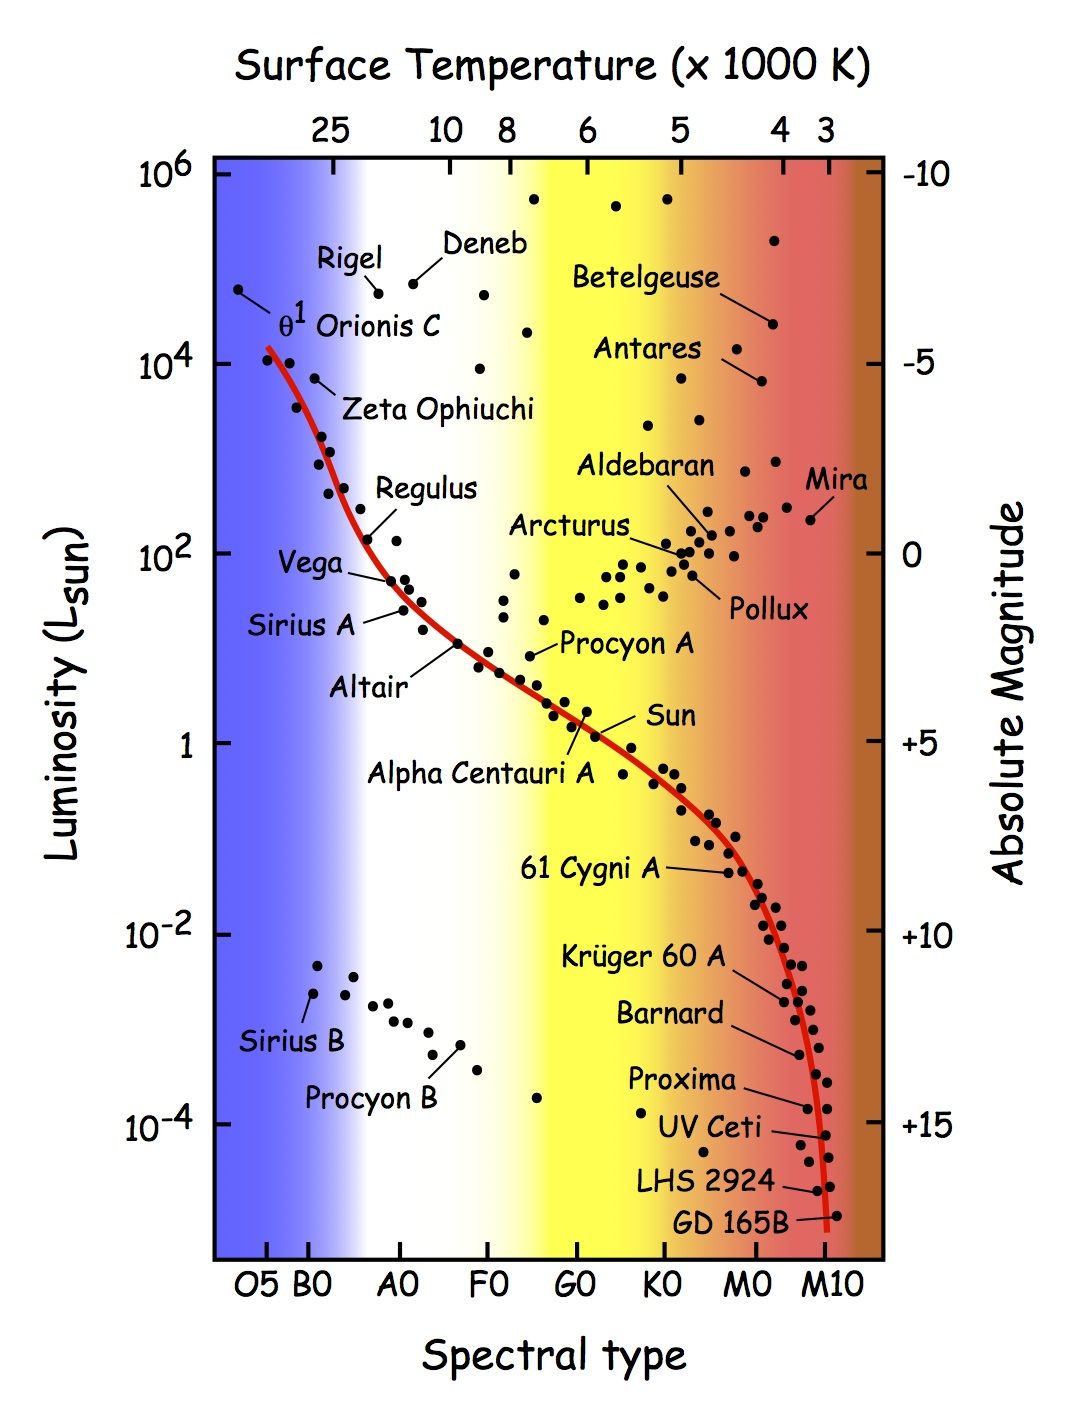
The Hertzsprung-Russell (H-R) diagram is a fundamental tool in astrophysics, providing a visual representation of the characteristics and evolution of stars. This diagram plots the intrinsic brightness of stars (luminosity or absolute magnitude) against their color index (often represented as B-V color or surface temperature), revealing significant information about their size, age, and future development. For students, astronomers, and enthusiasts interested in celestial phenomena, understanding the H-R diagram is not just educational but also deeply enriching, as it lays down the basics of stellar classification.
Why is the H-R Diagram Important?

The H-R diagram is crucial because:
- It categorizes stars into different types based on their physical properties.
- It shows the evolution of stars, helping to understand how stars change over their lifetimes.
- It serves as a predictive model for stellar behavior and stellar life cycles.
- It allows astronomers to compare and contrast stars across the universe, regardless of distance.
📚 Note: The H-R diagram is named after two astronomers, Ejnar Hertzsprung and Henry Norris Russell, who independently developed it in the early 20th century.
Understanding the Axes

Luminosity/Absolute Magnitude

The vertical axis of the H-R diagram represents:
- Luminosity: The total amount of energy a star emits per second, typically measured in terms of the Sun’s luminosity.
- Absolute Magnitude: A measure of intrinsic brightness; a lower number means brighter (i.e., negative magnitudes are brighter).
Color Index/Surface Temperature

The horizontal axis indicates:
- Color Index: A numerical measure of the star’s color, where a lower index means bluer (hotter) stars, and a higher index indicates redder (cooler) stars.
- Surface Temperature: The temperature of a star’s surface, commonly measured in Kelvin (K).
Key Features of the H-R Diagram

Main Sequence

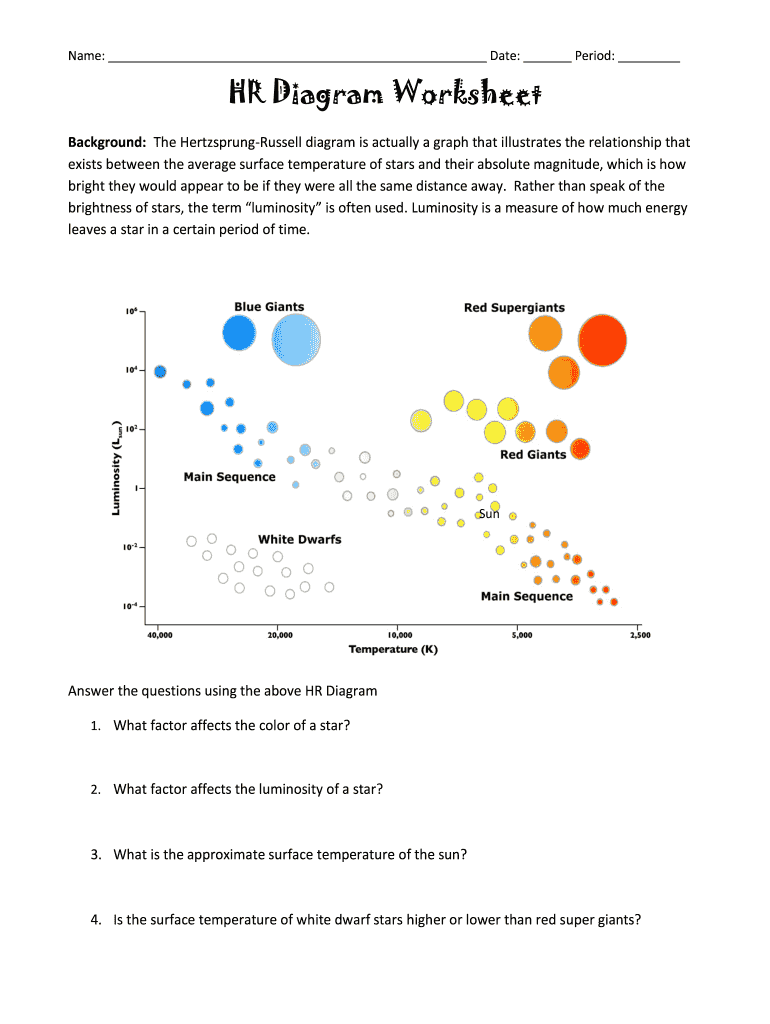
The vast majority of stars, including our Sun, fall along a diagonal band known as the Main Sequence. Here:
- Stars burn hydrogen into helium in their cores.
- The sequence shows a clear trend from blue, hot, and massive stars at the top left to red, cooler, and less massive stars at the bottom right.
Giant and Supergiant Branches

Above the Main Sequence are:
- Giants: These are large, evolved stars that have exhausted their core hydrogen. They are much larger and brighter than Main Sequence stars of the same temperature.
- Supergiants: Even more massive and luminous than Giants, these stars can exceed 100 times the Sun’s mass. They are nearing the end of their lives and can vary dramatically in temperature and luminosity.
White Dwarfs

At the bottom left of the diagram are:
- White Dwarfs: These are remnants of stars like our Sun, with high surface temperatures but very low luminosity due to their small size.
Variable Stars

Some stars change in brightness over time, tracing paths in the diagram:
- Cepheids and RR Lyrae: These stars pulsate, moving across the instability strip on the H-R diagram.
🚀 Note: Pulsating variables like Cepheids are critical for distance measurements because their period of pulsation is directly related to their luminosity.
Stellar Evolution on the H-R Diagram

Stars evolve across the H-R diagram throughout their lives:
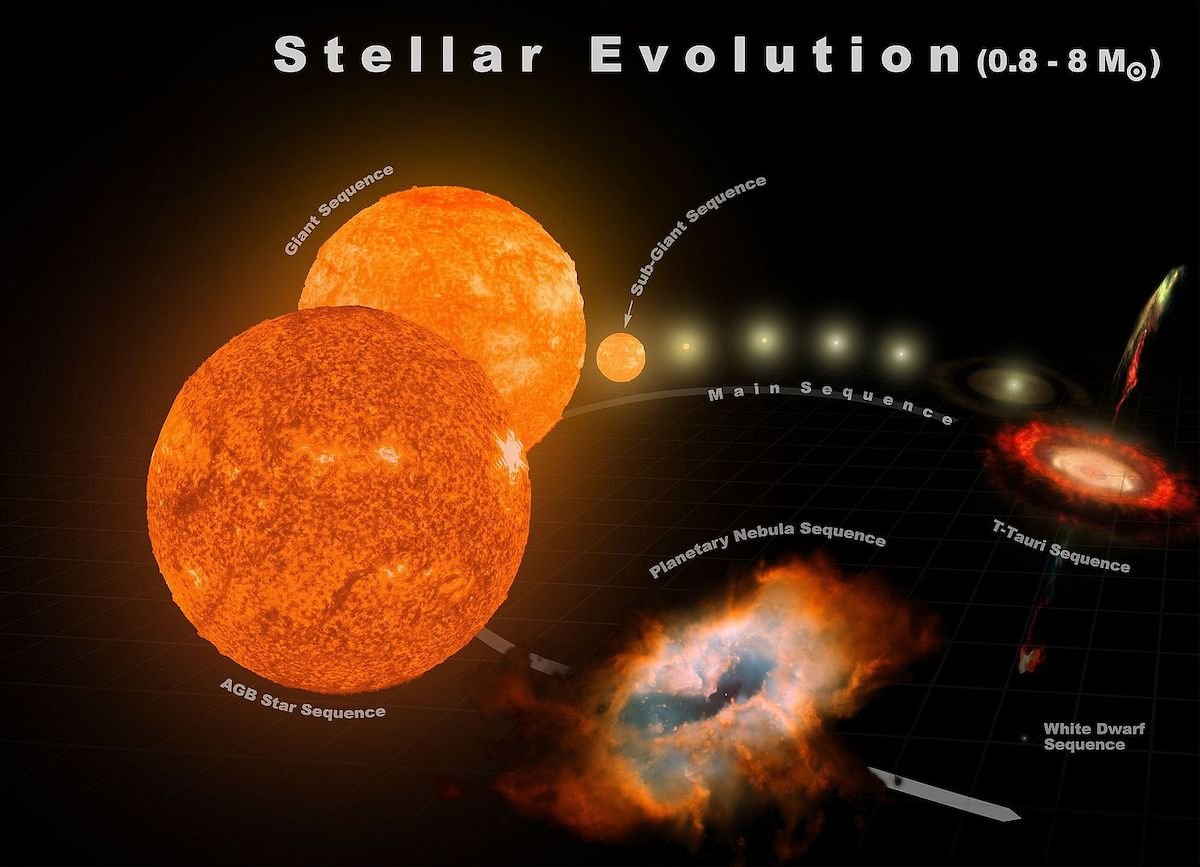
- Pre-Main Sequence: Stars form from protostellar clouds, initially appearing on the right side of the diagram, then migrating to the Main Sequence.
- Main Sequence Phase: Here, stars spend most of their lives. Massive stars move quickly through this phase due to faster burning of hydrogen.
- Post-Main Sequence: Once hydrogen is depleted, stars expand to become giants or supergiants, with low- to medium-mass stars moving upward on the diagram.
- End States: Depending on mass, stars end as white dwarfs, neutron stars, or black holes, all with different placements on the diagram.
Applications of the H-R Diagram

Beyond basic classification, the H-R diagram has several practical applications:
- Cluster Analysis: The distribution of stars within a star cluster can reveal its age, distance, and composition.
- Stellar Population Studies: To understand galaxy populations by looking at their H-R diagrams.
- Variable Star Period-Luminosity Relations: Used to calculate distances in the cosmos.
- Astrophysical Research: Helps in studying star formation, evolution, and the physics of stellar interiors.
Simplifying Stellar Classification

Here’s how to simplify the understanding of the H-R diagram:
| Star Type | Luminosity | Color | Evolutionary Phase |
|---|---|---|---|
| Main Sequence | Low to High | Blue to Red | Hydrogen Burning |
| Giants | High | Cooler | Expanding Phase |
| Supergiants | Very High | Various | Near End of Life |
| White Dwarfs | Low | Blue-Hot | End of Life (Cooling) |
| Variable Stars | Varying | Varying | Pulsating |

In Summary

In exploring the H-R diagram, we’ve uncovered the intricate details of how stars are classified based on their fundamental properties and evolutionary stages. From the brilliant main sequence to the cooling remnants, the H-R diagram not only categorizes but also narrates the life story of stars in a visual format. It simplifies the complexity of stellar evolution, enabling us to grasp the overarching principles of how stars function, evolve, and eventually meet their cosmic fates. With this understanding, we are better equipped to study, appreciate, and perhaps even predict the future of stars across the universe.
What does the main sequence on the H-R diagram represent?

+
The main sequence represents stars like our Sun, which are in a stable phase of hydrogen fusion in their cores, burning steadily for billions of years before moving on to their next evolutionary phase.
Can we predict a star’s future using the H-R diagram?

+
Yes, by understanding the star’s current position on the H-R diagram and its mass, astronomers can infer its past evolution and predict its future development, including how it will change in size, temperature, and luminosity.
How does the H-R diagram help in determining distances in space?

+
By studying variable stars like Cepheids, whose periods of variability correlate with their intrinsic luminosity, astronomers can use the H-R diagram to calculate the absolute magnitude of these stars. Knowing their apparent magnitude from Earth, they can then apply the inverse square law of light to determine distance.


