5 Ways to Differentiate Proportional and Non-Proportional Worksheets

When navigating the world of mathematics education, understanding the distinction between proportional and non-proportional worksheets is essential. These differences not only reflect the underlying mathematical concepts but also influence how educators design lessons and how students interpret and solve problems. Here are five key ways to differentiate between proportional and non-proportional worksheets, allowing for a deeper grasp of these fundamental relationships:
1. Graphical Representation


One of the most visually intuitive ways to differentiate between these types of worksheets is by examining their graphical representation:
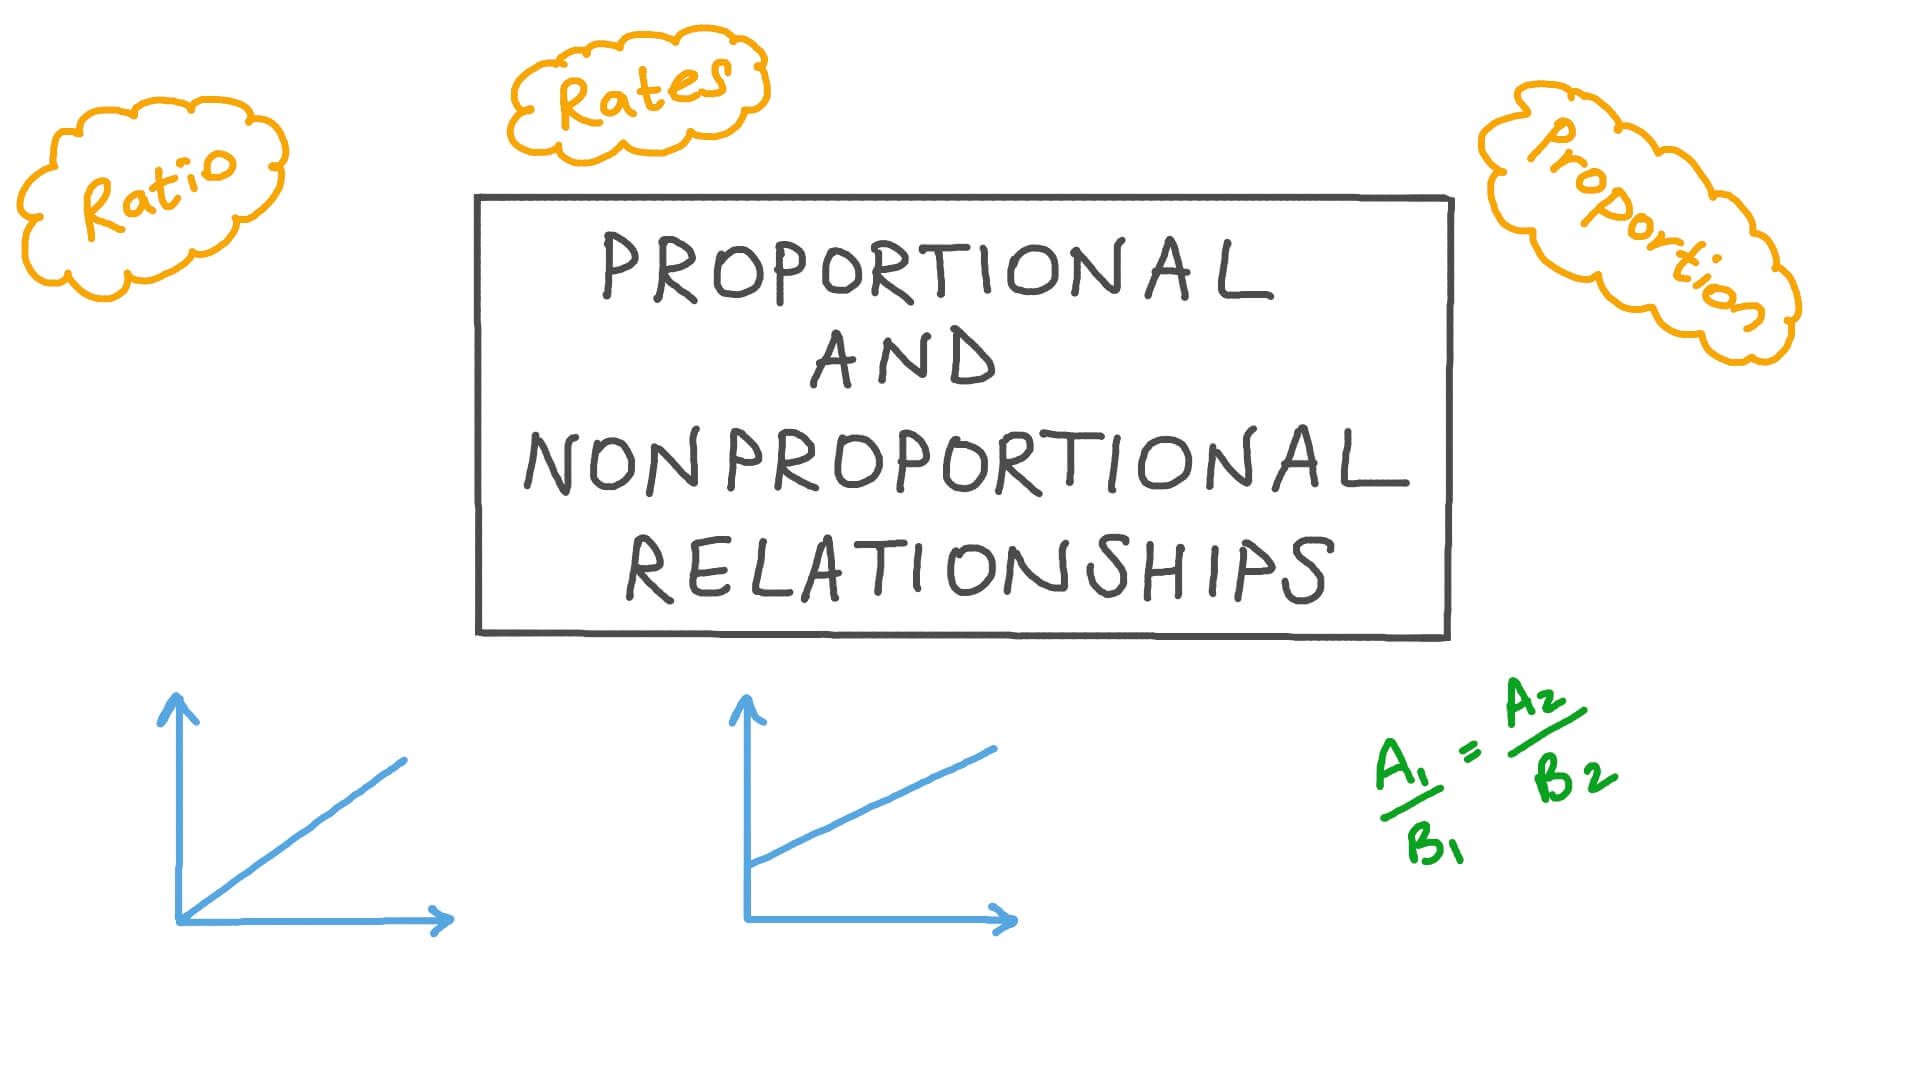
- Proportional Relationships: If the data points form a straight line passing through the origin, you’re looking at a proportional relationship. This line has a constant slope, which means for every unit increase in one variable, there’s a consistent increase in the other.
- Non-Proportional Relationships: Conversely, if the graph does not pass through the origin or if it’s not a straight line, the relationship is non-proportional. This indicates that there’s a fixed starting point or some other variable affecting the relationship, like a slope that changes or a y-intercept.
2. Understanding Ratios

Another approach to distinguish between these worksheets involves the use of ratios:
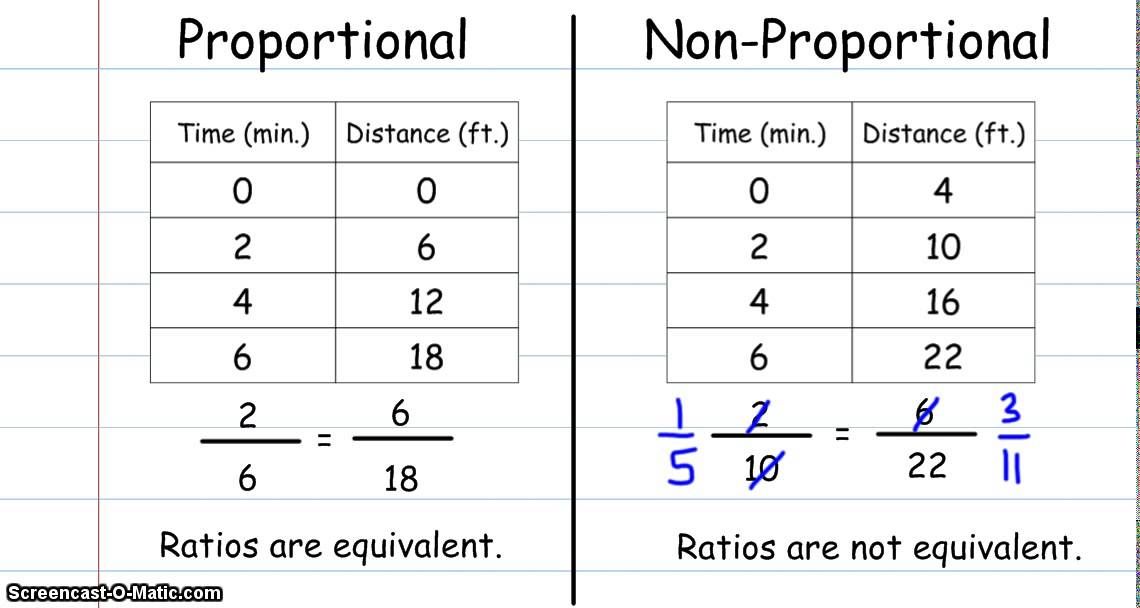
- Proportional Worksheets: Here, the ratios of the two quantities are always equivalent, maintaining a constant rate of change. For example, if 2 apples cost 1, then 4 apples will cost 2.
- Non-Proportional Worksheets: The ratio between the quantities varies. In these worksheets, one quantity might not change proportionally with the other due to other influencing factors.
3. Linear Equations and Slope

The nature of the equation in a worksheet can provide significant insight:
| Worksheet Type | Equation Form | Characteristics |
|---|---|---|
| Proportional | y = mx (m is non-zero) | No y-intercept (y=0 when x=0), constant slope |
| Non-Proportional | y = mx + b (b ≠ 0) or higher-order equations | Presence of y-intercept or non-constant slope |

While worksheets might not always present equations directly, understanding these forms helps in identifying the type of relationship.
4. Word Problems and Context

The context of problems in worksheets can indicate whether the relationship is proportional or not:
- Proportional Problems: Often involve simple rates, speeds, or direct comparisons where the relationship remains constant. For instance, calculating mileage or currency exchange.
- Non-Proportional Problems: These might include scenarios where there’s a fixed cost, overhead, or any situation where a starting point or a minimum amount affects the outcome, like service fees or base salaries.
5. Response to Change

Understanding how the variables respond to changes can be an effective differentiator:
- Proportional: If one variable changes by a factor, the other changes by the same factor. Doubling one value doubles the other, maintaining proportionality.
- Non-Proportional: Changes might not be reflected proportionally; the relationship could involve different rates of change, or the change might be influenced by other factors.
By considering these five aspects, educators and students can better discern the type of worksheets they're working with, ensuring they're applying the appropriate mathematical strategies. It's crucial for understanding how different concepts in mathematics function and interact, providing a solid foundation for further mathematical exploration. Whether through graphical analysis, understanding ratios, examining linear equations, interpreting word problems, or analyzing response to change, these methods offer clear avenues for differentiation.
📝 Note: Always verify the type of relationship presented in a problem by looking for clues like a non-zero y-intercept or variable slopes to ensure you're using the correct mathematical approach.
Why is it important to differentiate between proportional and non-proportional relationships in mathematics?

+
Understanding the type of relationship helps students choose the right method to solve problems. Proportional relationships can often be solved using simple multiplication or division, whereas non-proportional relationships might require more complex algebraic manipulation.
Can you have a proportional relationship that doesn’t start at the origin?

+
A true proportional relationship must start at the origin (0,0) on a graph, meaning if one quantity is zero, the other must be as well. If the relationship starts at any other point, it includes a non-zero y-intercept, making it non-proportional.
How does teaching proportional and non-proportional relationships benefit students?

+
It helps students develop critical thinking skills by recognizing different mathematical patterns and applying appropriate problem-solving strategies. It also prepares them for more advanced mathematical concepts where these distinctions are crucial.


