Mastering Mean, Median, Mode, and Range with Worksheets

Understanding Basic Statistics

Statistics is a vital part of data analysis that helps in interpreting and making sense of data. Whether you’re preparing for an academic test, analyzing a dataset, or just curious about numbers, understanding mean, median, mode, and range is essential. Here’s a detailed guide that simplifies these concepts through practical examples and worksheets.
Mean

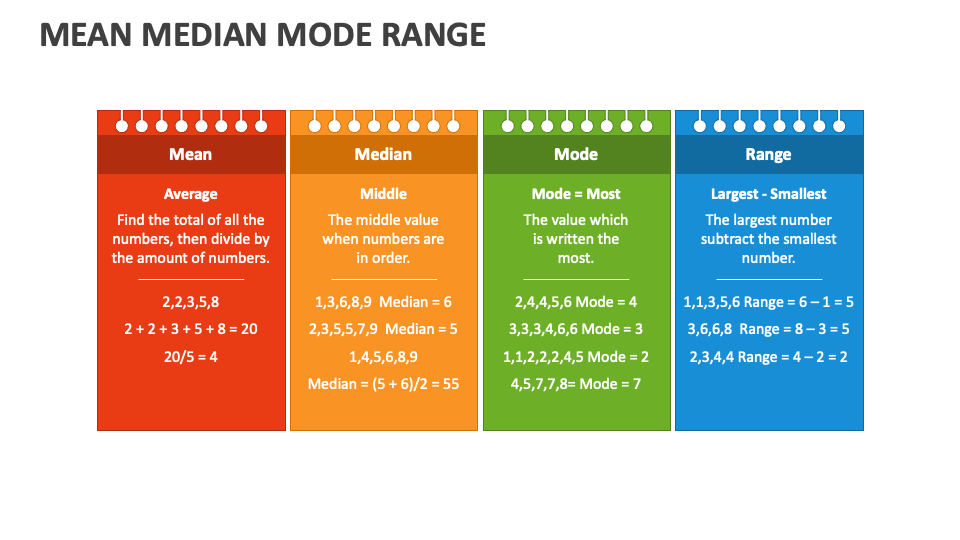
The mean, often referred to as the average, is calculated by adding up all the numbers and dividing by the count of those numbers. Here’s how you can find it:
- Add all the numbers in your dataset.
- Count how many numbers you have.
- Divide the sum by the count.
| Data | Sum | Count | Mean |
|---|---|---|---|
| 2, 4, 6, 8, 10 | 30 | 5 | 6 |

📌 Note: The mean is sensitive to outliers, which means extreme values can significantly skew the average.
Median

The median is the middle value in a list of numbers. If your dataset has an odd number of observations, you find the value at the center:
- Sort the numbers from smallest to largest.
- Find the middle number.
If you have an even number of observations, the median is the average of the two middle numbers:
- Sort the numbers.
- Add the two middle numbers and divide by 2.
| Data | Median |
|---|---|
| 2, 4, 6, 8, 10 | 6 |
| 2, 4, 6, 8 | 5 |
Mode

The mode is the value that appears most frequently in a dataset. Here’s how to find it:
- Count how many times each value appears.
- The value with the highest count is the mode.
If no number repeats, or if all numbers repeat an equal number of times, there is no mode. You can have more than one mode if multiple values appear the same maximum number of times:
| Data | Mode |
|---|---|
| 1, 2, 3, 3, 4 | 3 |
| 1, 2, 3, 4 | No Mode |
Range

Range measures the spread of the data:
- Identify the smallest and largest numbers in your dataset.
- Subtract the smallest from the largest.
| Data | Smallest | Largest | Range |
|---|---|---|---|
| 2, 4, 6, 8, 10 | 2 | 10 | 8 |
Worksheets for Practice

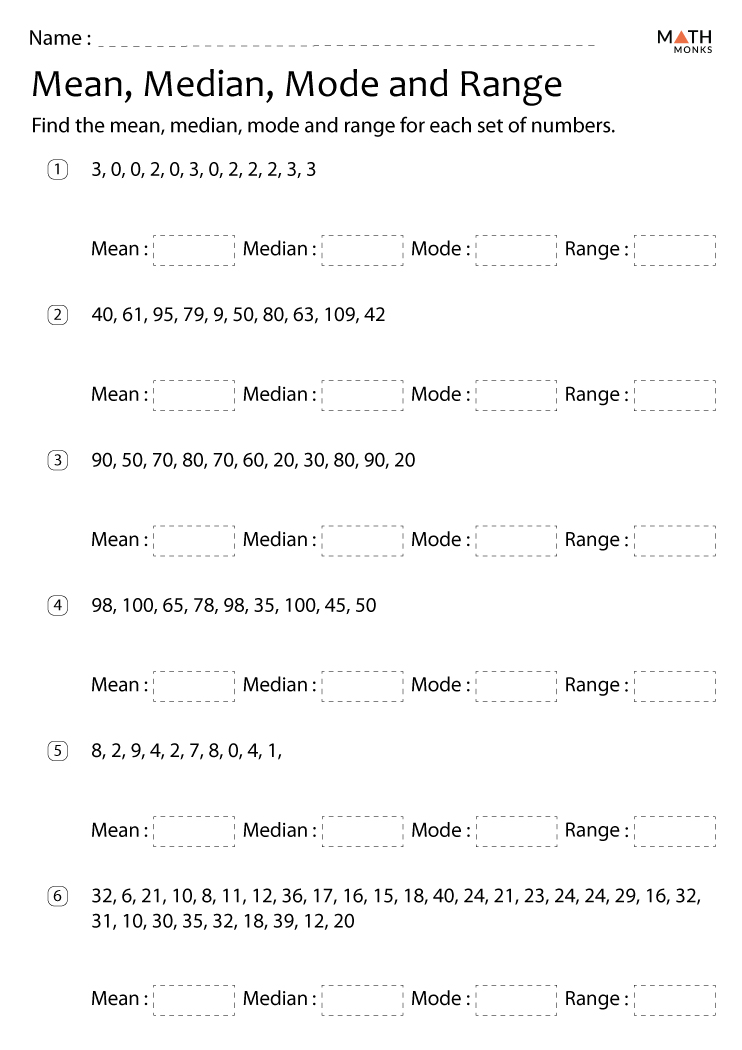
Practice is key to mastering these statistical measures. Here are some worksheet ideas:
- Find the Mean: Provide students with datasets and ask them to calculate the mean.
- Determine the Median: Have students arrange numbers in order and find the median.
- Identify the Mode: Give datasets where students need to count occurrences to find the mode.
- Calculate the Range: Students identify the smallest and largest numbers to compute the range.
- Application Exercises: Include real-world scenarios where understanding these measures is crucial, like budgeting, sports statistics, or academic results.
🔔 Note: Worksheets should vary in difficulty to cater to different learning levels.
In conclusion, understanding mean, median, mode, and range not only provides a foundation for data analysis but also improves problem-solving skills. These statistical measures help us summarize datasets effectively, allowing for better decision-making in various fields. By engaging with worksheets, you're not just learning; you're applying these concepts to real-life situations, enhancing your comprehension and retention.
Why is the median often better than the mean for skewed data?

+
The median is often better for skewed data because it’s less affected by outliers or extreme values. In a skewed distribution, the mean can be pulled towards the tail of the skew, giving a misleading picture of central tendency.
Can there be more than one mode in a dataset?

+
Yes, if multiple values in a dataset occur with the same highest frequency, then the dataset can have more than one mode. This is known as multimodal distribution.
How can I use these measures in everyday life?

+
These statistical measures can be applied in budgeting, understanding grades or performance scores, analyzing customer ratings, or even in sports to evaluate players’ performance.