Excel
Separate Class Intervals in Excel Easily
Introduction to Class Intervals in Excel
When dealing with large datasets in Excel, organizing and analyzing data becomes more manageable with the help of class intervals. Class intervals, also known as bins or groups, are ranges of values that help categorize continuous data into discrete groups. This process is essential for creating frequency distributions, histograms, and other statistical analyses. In this post, we will explore how to separate class intervals in Excel easily and efficiently.
Understanding Class Intervals
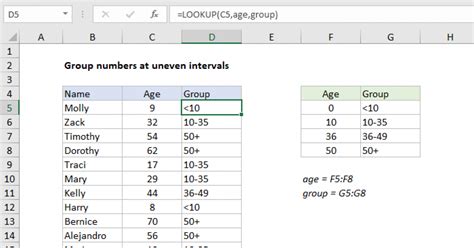
Before diving into the process of creating class intervals in Excel, it’s crucial to understand what they represent. A class interval is a range of values within which a dataset’s values fall. For instance, if you’re analyzing exam scores, a class interval might be 70-79, 80-89, etc. Each interval includes a lower and upper bound, and the width of the interval (the difference between the upper and lower bounds) can be fixed or variable, depending on the analysis requirements.
Preparing Your Data

To separate class intervals in Excel, your data should be organized in a column. Ensure that your data is numeric and continuous, as class intervals are most useful with this type of data. If your data contains non-numeric values or is not in a continuous format, you may need to adjust it before proceeding.
Creating Class Intervals Manually

Creating class intervals manually involves deciding on the interval width and then categorizing each data point into its respective interval. Here’s a step-by-step guide:
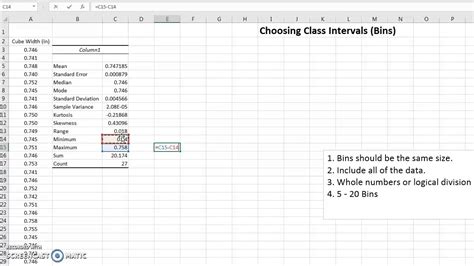
- Decide on the Interval Width: Determine the width of each class interval. A common approach is to use the formula: Interval Width = (Max Value - Min Value) / Number of Intervals. The number of intervals can be chosen based on the Sturges’ rule, which suggests 1 + 3.3 log(n), where n is the number of observations.
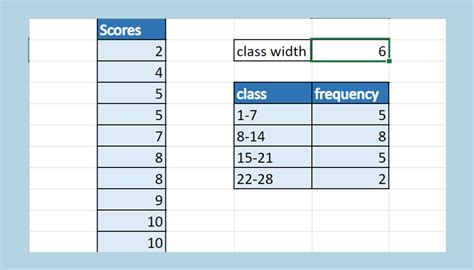
- List the Intervals: Once you have the width, you can list out the intervals starting from the minimum value of your dataset and adding the interval width successively.
- Assign Data Points to Intervals: You can then use the IF function or filtering to assign each data point to its corresponding interval.
Using Formulas for Dynamic Class Intervals
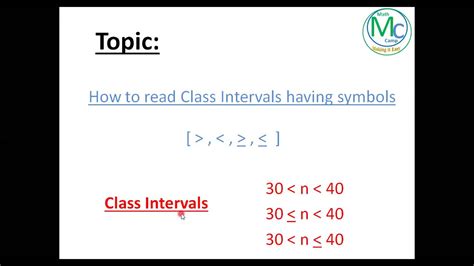
For a more dynamic approach, especially with large datasets, using formulas can automate the process of assigning data points to class intervals.
- Using the IF Function: The IF function can be used to check which interval a data point falls into. For example, if your intervals are based on scores and you want to check if a score falls into the 70-79 range, you could use a formula like
=IF(AND(A1>=70, A1<=79), "70-79", "Outside this range"). - Using the FREQUENCY Function: The FREQUENCY function in Excel is specifically designed for categorizing data into intervals. The syntax is
FREQUENCY(data_array, bins_array), wheredata_arrayis the range of cells containing the data andbins_arrayis the range of cells containing the intervals.
Visualizing Class Intervals with Histograms

After creating class intervals, a common next step is to visualize the distribution of your data using a histogram. Excel provides a built-in tool for creating histograms, which automatically categorizes your data into intervals and displays the frequency of each interval.
- Using the Analysis ToolPak: The Analysis ToolPak in Excel offers a histogram tool. To access it, go to
Data>Data Analysis>Histogram, and then follow the prompts to select your data and bins. - Using the Histogram Function in Excel 2016 and Later: In newer versions of Excel, you can use the
HISTOGRAMfunction directly or use theExcel Histogramtool found in theInsert>Chartsection.
Important Considerations

When working with class intervals, consider the following: - Interval Width Consistency: For most analyses, it’s best to keep the interval width consistent to ensure that each interval represents an equal range of values. - Boundary Values: Decide how to handle values that fall exactly on the boundary between two intervals. This could be by including them in the higher interval, the lower interval, or by some other rule that makes sense for your data.
📝 Note: Always validate your intervals and the distribution of your data after creating class intervals to ensure they accurately represent your dataset and meet the requirements of your analysis.
Conclusion and Future Steps

Separating class intervals in Excel is a fundamental step in data analysis that can significantly simplify the process of understanding and visualizing your data. By following the steps outlined above, you can efficiently categorize your continuous data into meaningful groups. Remember, the key to effective use of class intervals is understanding your data and choosing intervals that best reveal the underlying patterns and trends. With practice, you’ll become more adept at selecting the right interval widths and applying class intervals to uncover insights in your data.
What is the purpose of class intervals in data analysis?

+
Class intervals are used to categorize continuous data into discrete groups, making it easier to analyze and understand the distribution of the data.
How do I choose the right interval width for my data?
+
The interval width can be chosen based on the range of the data and the desired number of intervals. A common approach is to use the formula: Interval Width = (Max Value - Min Value) / Number of Intervals.
Can I use Excel’s built-in functions to create histograms and class intervals?
+
Yes, Excel provides several tools and functions, including the FREQUENCY function and the histogram tool, to help create class intervals and visualize data distributions.