Run Anova In Excel Easily

Introduction to ANOVA in Excel

Analysis of Variance, commonly referred to as ANOVA, is a statistical technique used to compare means of two or more samples to find out if there is a significant difference between them. It is a powerful tool in data analysis, especially when dealing with experiments or studies that involve multiple groups. Microsoft Excel, being a versatile and widely used spreadsheet program, provides an easy way to run ANOVA tests through its Analysis ToolPak add-in. In this article, we will explore how to easily run ANOVA in Excel.
Prerequisites for Running ANOVA in Excel

Before you start, ensure that you have the following: - Microsoft Excel installed on your computer. - The Analysis ToolPak add-in enabled. If it’s not already enabled, you can do so by going to File > Options > Add-ins, then select Analysis ToolPak and click OK. - Your data organized in a table format, with each group’s data in separate columns or rows, depending on the type of ANOVA you wish to perform.
Types of ANOVA

There are several types of ANOVA tests, including: - One-Way ANOVA: Used to compare the means of three or more samples to find out if at least one group mean is different. - Two-Way ANOVA: Used when there are two independent variables and you want to see if there’s an interaction between them. - Repeated Measures ANOVA: Used when the same subjects are measured under different conditions.
Step-by-Step Guide to Running ANOVA in Excel

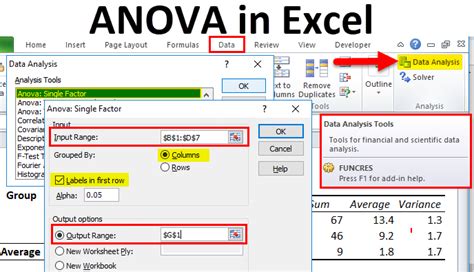
Here’s how you can perform a one-way ANOVA in Excel: 1. Prepare Your Data: Ensure your data is well-organized. For a one-way ANOVA, each group should be in a separate column. 2. Go to the Data Tab: Click on the Data tab in the ribbon. 3. Click on Data Analysis: In the Analysis group, click on Data Analysis. If you don’t see this option, you might need to activate the Analysis ToolPak as mentioned earlier. 4. Select ANOVA: In the Data Analysis dialog box, scroll down and select ANOVA: Single Factor (for one-way ANOVA), then click OK. 5. Input Your Data Range: In the ANOVA: Single Factor dialog box, enter the range of cells that contain your data. Make sure to include the headers if your data has them. 6. Choose Your Grouping: Decide whether your data is grouped by rows or columns. For most setups, this will be by columns. 7. Set Alpha Value (Optional): The default alpha value is 0.05. You can change this if your analysis requires a different significance level. 8. Output Range: Choose where you want the output to be displayed. It’s usually best to select a new range that doesn’t overlap with your data. 9. Click OK: Excel will then perform the ANOVA test and display the results in the specified output range.
Interpreting ANOVA Results in Excel

The ANOVA output in Excel includes several pieces of information, but the key things to look for are: - F-value: This is the ratio of the variance between groups to the variance within groups. - P-value: This tells you the probability of observing the F-value (or a more extreme value) if the null hypothesis were true. If the p-value is less than your chosen alpha level (usually 0.05), you reject the null hypothesis, indicating that there is a significant difference between the groups.
Example Use Case

Suppose you are a marketing manager and you want to know if there is a significant difference in the average sales of three different products. You collect data on the sales of each product over a period and use one-way ANOVA to compare the means. If the p-value is less than 0.05, you can conclude that at least one of the products has significantly different sales from the others.
Using ANOVA for Decision Making

ANOVA is a powerful tool for decision making in various fields, including business, healthcare, and social sciences. By determining if there are significant differences between groups, you can: - Optimize Processes: Identify which processes or factors contribute to significant outcomes. - Target Specific Groups: In marketing, for example, knowing which demographic groups respond differently to certain products can help in targeting advertisements. - Improve Products or Services: By comparing different versions of a product or service, you can identify which features or improvements lead to better outcomes.
💡 Note: Always ensure that your data meets the assumptions of ANOVA, including normality and equal variances, for the results to be reliable.
In summary, running ANOVA in Excel is a straightforward process that can provide valuable insights into your data. By following the steps outlined and understanding how to interpret the results, you can make more informed decisions in your personal and professional endeavors.
What is the primary use of ANOVA in data analysis?

+
The primary use of ANOVA is to compare means of two or more samples to find out if there is a significant difference between them.
How do I enable the Analysis ToolPak in Excel?

+
To enable the Analysis ToolPak, go to File > Options > Add-ins, select Analysis ToolPak, and click OK.
What does the p-value in ANOVA results indicate?

+
The p-value indicates the probability of observing the F-value (or a more extreme value) if the null hypothesis were true. A p-value less than 0.05 typically indicates a significant difference between groups.


