5 Ways To Get P Value
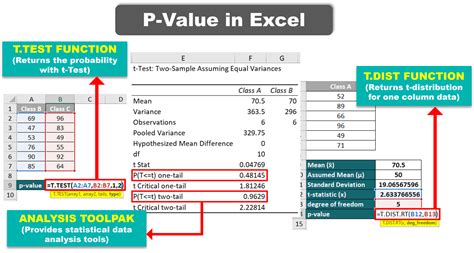
Introduction to P-Value
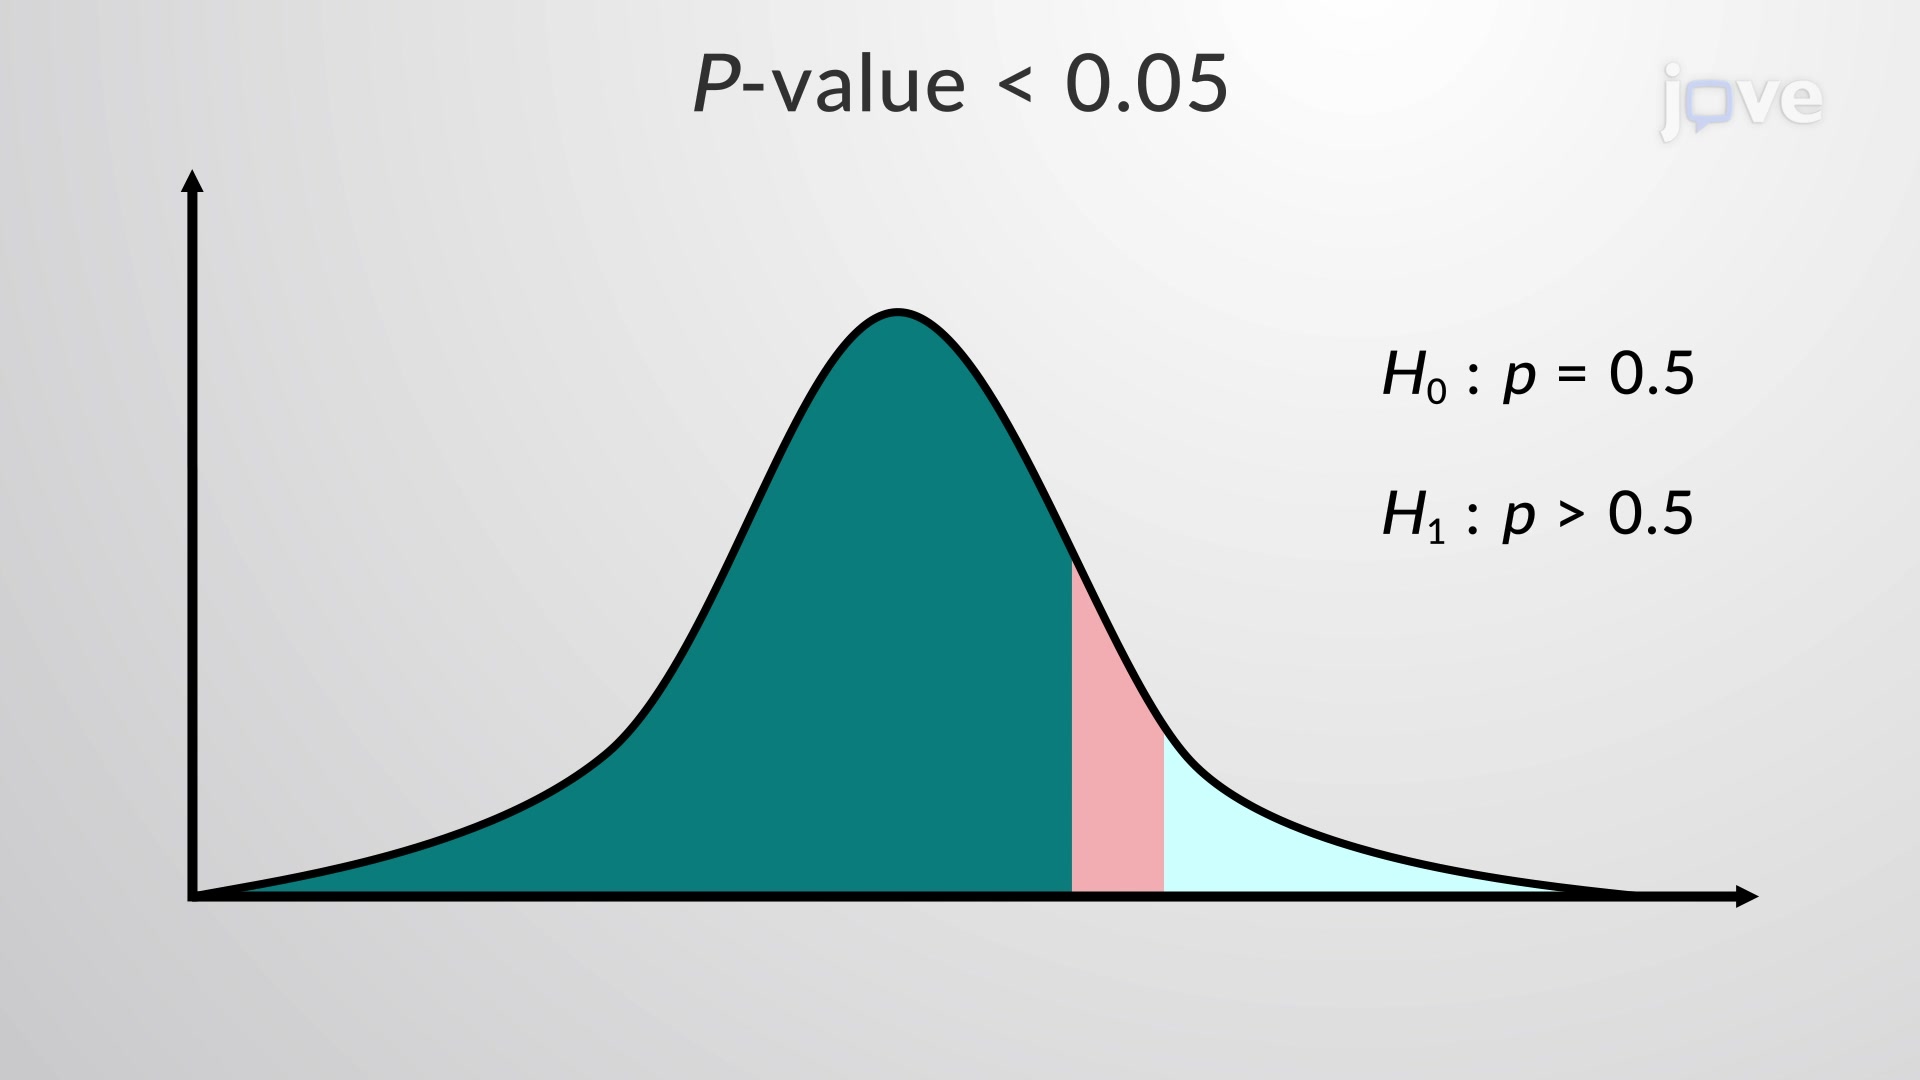
The p-value, or probability value, is a key concept in statistical hypothesis testing, representing the probability of observing results at least as extreme as those observed during the experiment or study, assuming that the null hypothesis is true. The p-value is crucial for determining the significance of the results, helping researchers decide whether to reject the null hypothesis. A small p-value (typically less than 0.05) indicates that the observed data would be very unlikely under the null hypothesis, suggesting that the null hypothesis should be rejected in favor of the alternative hypothesis.
Understanding the P-Value Concept
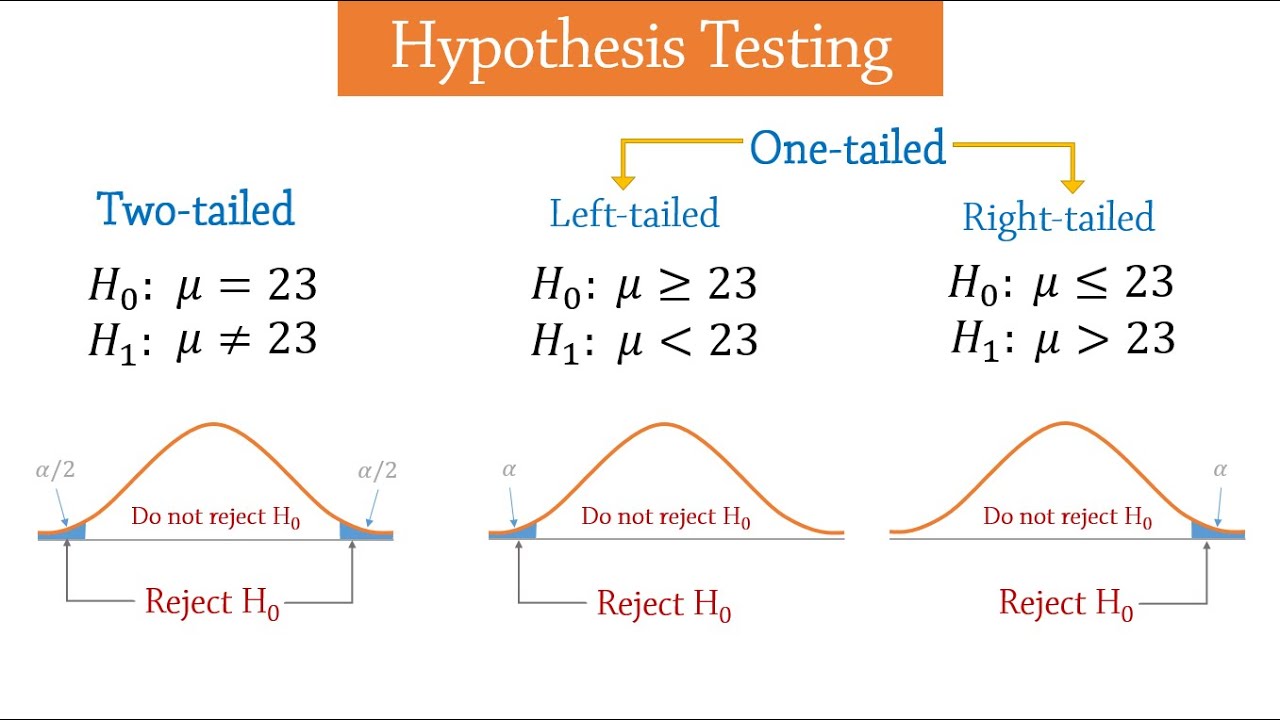
Before diving into the methods for obtaining a p-value, it’s essential to grasp what the p-value signifies. The p-value does not measure the probability that the null hypothesis is true or that the alternative hypothesis is true. Instead, it measures the probability of obtaining the observed results (or more extreme) if the null hypothesis were true. This distinction is critical for correctly interpreting p-values in research.
Methods for Obtaining P-Value

There are several approaches to calculate or obtain a p-value, depending on the nature of the data, the type of test, and the statistical software being used. Here are five common ways to get a p-value:
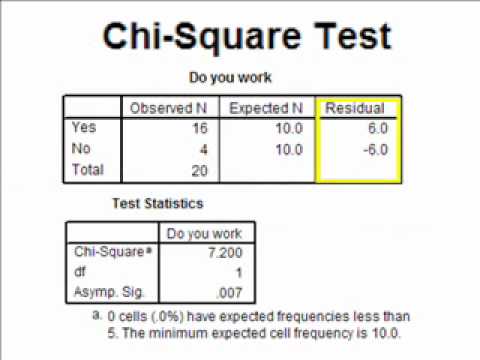
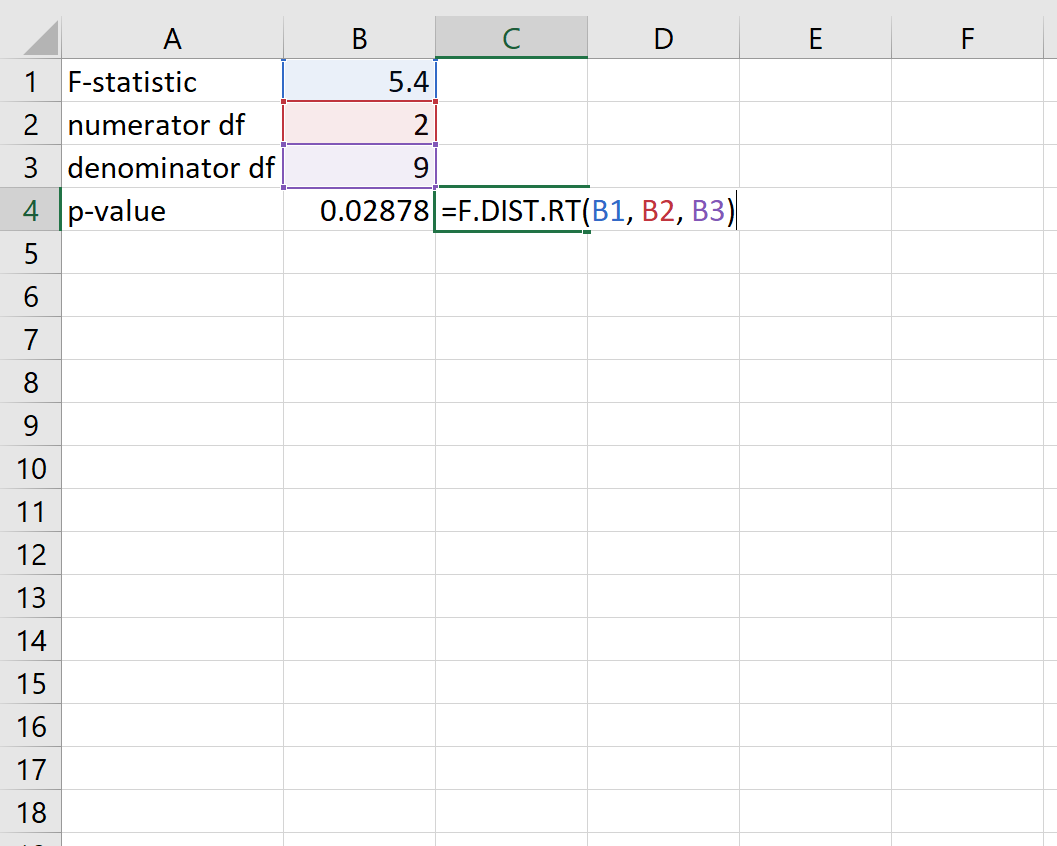
Using Statistical Software: Most statistical analysis is conducted using software like R, Python libraries (e.g., SciPy, Statsmodels), SPSS, or SAS. These programs can perform a wide range of statistical tests (t-tests, ANOVA, regression analysis, etc.) and automatically calculate the p-value based on the input data and chosen test.
Z-Table or T-Table Lookup: For simple hypothesis tests involving means (e.g., one-sample z-test, two-sample t-test), p-values can be estimated by looking up the test statistic in a standard normal distribution (Z-table) or t-distribution (T-table) table. These tables provide the area to the left of the test statistic, which, depending on the test, can directly give the p-value or require doubling the area for a two-tailed test.
Simulation and Resampling Methods: In cases where the distribution of the test statistic is unknown or complex, simulation techniques like bootstrapping can be used to estimate the p-value. These methods involve repeatedly resampling the data (with replacement) and recalculating the test statistic, then determining the proportion of times the resampled test statistic is at least as extreme as the observed test statistic, which serves as an estimate of the p-value.
Exact Tests: For certain types of data, especially categorical data, exact tests like Fisher’s Exact Test can be used. These tests calculate the p-value exactly by considering all possible tables that could have arisen given the fixed marginals, without relying on large sample approximations.
Approximations and Asymptotic Tests: Many statistical tests rely on approximations that become more accurate as the sample size increases. For example, the chi-square test for categorical data or the Wald test in logistic regression rely on asymptotic properties of the test statistics to approximate the p-value. These methods are widely used due to their simplicity and availability in statistical software but require sufficiently large sample sizes for the approximations to be valid.
Interpreting P-Values

Interpreting p-values correctly is crucial. A small p-value (e.g., < 0.05) suggests that the data provide sufficient evidence to reject the null hypothesis in favor of the alternative hypothesis. However, it does not indicate the size or practical significance of the effect. Conversely, a large p-value indicates that the data do not provide sufficient evidence to reject the null hypothesis, but it does not prove the null hypothesis; it merely fails to disprove it.
📝 Note: The choice of the significance level (commonly set at 0.05) is somewhat arbitrary and should be considered in the context of the research question and the potential consequences of Type I and Type II errors.
Common Misconceptions About P-Values
- Misinterpreting the p-value as the probability that the null hypothesis is true: The p-value does not tell us the probability that the null hypothesis is true; it tells us the probability of observing our data (or something more extreme) if the null hypothesis were true. - Overemphasizing statistical significance over practical significance: A result can be statistically significant (low p-value) but not practically significant if the effect size is very small. - Failing to consider multiple testing: When many tests are conducted, some will yield significant results by chance, leading to false positives.
In summary, p-values are a crucial tool in statistical hypothesis testing, guiding researchers in their decision to reject or fail to reject the null hypothesis. Understanding how to obtain and interpret p-values, as well as being aware of common misconceptions, is essential for conducting and evaluating research.
To recap, the methods for obtaining p-values include using statistical software, looking up test statistics in standard tables, employing simulation and resampling methods, utilizing exact tests, and relying on approximations and asymptotic tests. Each method has its own set of assumptions and is suited for different types of data and research questions. By selecting the appropriate method and correctly interpreting the p-value, researchers can draw meaningful conclusions from their data.
What does a p-value signify in statistical hypothesis testing?

+
A p-value represents the probability of observing results at least as extreme as those observed, assuming that the null hypothesis is true. It helps in deciding whether to reject the null hypothesis in favor of the alternative hypothesis.
How do you determine the significance level for a p-value?

+
The significance level, often set at 0.05, is somewhat arbitrary and should be considered in the context of the research question and the potential consequences of Type I and Type II errors.
What is the difference between statistical significance and practical significance?
+
Statistical significance refers to the likelihood of observing the results (or more extreme) assuming the null hypothesis is true, indicated by a low p-value. Practical significance, on the other hand, refers to the actual impact or difference the results suggest, which can be small even if statistically significant.


