Find Descriptive Stats In Excel
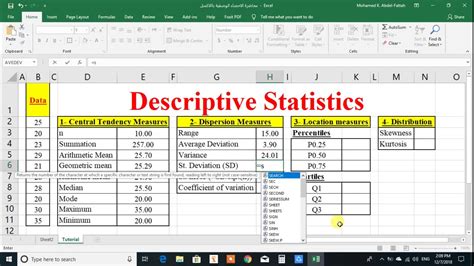
Introduction to Descriptive Statistics in Excel
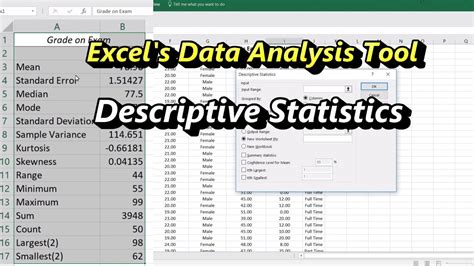
Descriptive statistics is a crucial aspect of data analysis, providing an overview of the basic features of a dataset, including measures of central tendency, dispersion, and distribution shape. Excel, a powerful spreadsheet software, offers a range of tools and functions to calculate descriptive statistics. In this post, we will explore how to find descriptive statistics in Excel, including the use of formulas, functions, and the Analysis ToolPak.
Measures of Central Tendency

Measures of central tendency, such as the mean, median, and mode, describe the middle or typical value of a dataset. To calculate these measures in Excel, you can use the following formulas and functions:
- Mean: The average value of a dataset, calculated using the formula
=AVERAGE(range)or the function=SUM(range)/COUNT(range). - Median: The middle value of a dataset when it is sorted in ascending order, calculated using the formula
=MEDIAN(range). - Mode: The most frequently occurring value in a dataset, calculated using the formula
=MODE(range).
For example, suppose we have a dataset of exam scores in the range A1:A10. To calculate the mean, median, and mode, we can use the following formulas:
| Formula | Description |
|---|---|
| =AVERAGE(A1:A10) | Calculate the mean |
| =MEDIAN(A1:A10) | Calculate the median |
| =MODE(A1:A10) | Calculate the mode |
Measures of Dispersion

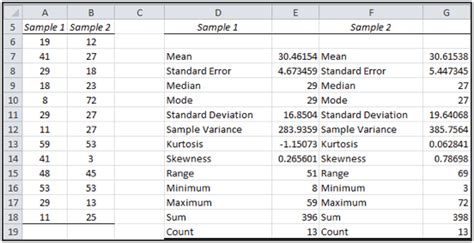
Measures of dispersion, such as the range, variance, and standard deviation, describe the spread or variability of a dataset. To calculate these measures in Excel, you can use the following formulas and functions:
- Range: The difference between the largest and smallest values in a dataset, calculated using the formula
=MAX(range)-MIN(range). - Variance: A measure of the spread of a dataset, calculated using the formula
=VAR(range). - Standard Deviation: The square root of the variance, calculated using the formula
=STDEV(range).
For example, suppose we have a dataset of stock prices in the range B1:B10. To calculate the range, variance, and standard deviation, we can use the following formulas:
| Formula | Description |
|---|---|
| =MAX(B1:B10)-MIN(B1:B10) | Calculate the range |
| =VAR(B1:B10) | Calculate the variance |
| =STDEV(B1:B10) | Calculate the standard deviation |
Using the Analysis ToolPak

The Analysis ToolPak is an Excel add-in that provides a range of statistical tools, including descriptive statistics. To access the Analysis ToolPak, go to the “Data” tab and click on “Data Analysis”. Then, select “Descriptive Statistics” from the list of available tools.
The Descriptive Statistics tool provides a range of output options, including measures of central tendency, dispersion, and distribution shape. To use the tool, follow these steps:
- Select the dataset you want to analyze.
- Go to the “Data” tab and click on “Data Analysis”.
- Select “Descriptive Statistics” from the list of available tools.
- Click “OK” to run the tool.
- Select the output options you want to display.
The output will include a range of descriptive statistics, including the mean, median, mode, range, variance, and standard deviation.
📝 Note: Make sure to select the correct dataset and output options to ensure accurate results.
Interpreting Descriptive Statistics
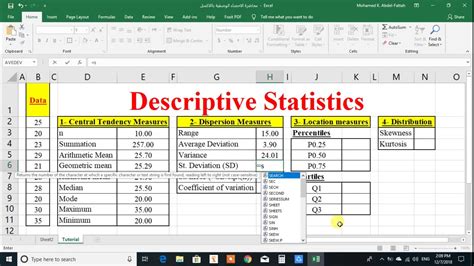
Descriptive statistics provide a summary of the basic features of a dataset. To interpret descriptive statistics, consider the following:
- Mean: A high mean may indicate a high average value, while a low mean may indicate a low average value.
- Median: A high median may indicate a skewed distribution, while a low median may indicate a symmetric distribution.
- Mode: A high mode may indicate a frequent value, while a low mode may indicate a rare value.
- Range: A high range may indicate a wide spread, while a low range may indicate a narrow spread.
- Variance: A high variance may indicate a high spread, while a low variance may indicate a low spread.
- Standard Deviation: A high standard deviation may indicate a high spread, while a low standard deviation may indicate a low spread.
By interpreting descriptive statistics, you can gain insights into the characteristics of a dataset and make informed decisions.
What is the difference between the mean and median?

+
The mean is the average value of a dataset, while the median is the middle value when the dataset is sorted in ascending order.
How do I calculate the range in Excel?
+
You can calculate the range in Excel using the formula =MAX(range)-MIN(range).
What is the purpose of the Analysis ToolPak in Excel?
+
The Analysis ToolPak is an Excel add-in that provides a range of statistical tools, including descriptive statistics.
In summary, descriptive statistics provide a summary of the basic features of a dataset, including measures of central tendency, dispersion, and distribution shape. Excel provides a range of tools and functions to calculate descriptive statistics, including formulas, functions, and the Analysis ToolPak. By interpreting descriptive statistics, you can gain insights into the characteristics of a dataset and make informed decisions.


