Edit Pivot Table Excel Easily
Introduction to Pivot Tables in Excel
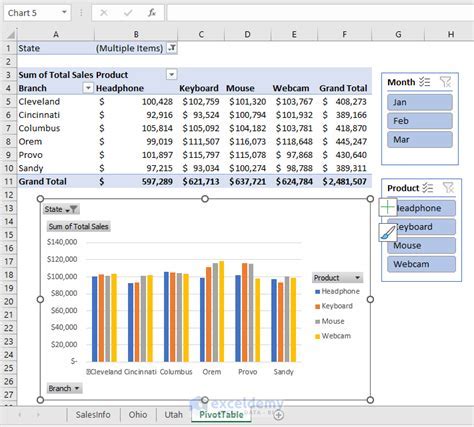
Pivot tables are a powerful tool in Excel that allows users to summarize and analyze large datasets with ease. They provide a flexible way to rotate and aggregate data, making it easier to extract insights and meaningful information. With pivot tables, you can quickly change the layout of your data, apply filters, and perform various calculations to gain a deeper understanding of your data.
Creating a Pivot Table in Excel
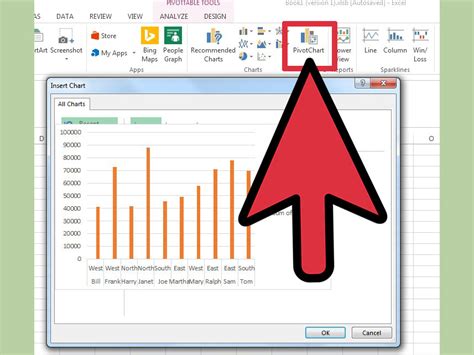
To create a pivot table in Excel, follow these steps: * Select the cell where you want to place the pivot table * Go to the Insert tab in the ribbon * Click on PivotTable * Choose the table or range of cells you want to use for the pivot table * Select the location where you want to place the pivot table * Click OK to create the pivot table
Understanding Pivot Table Components
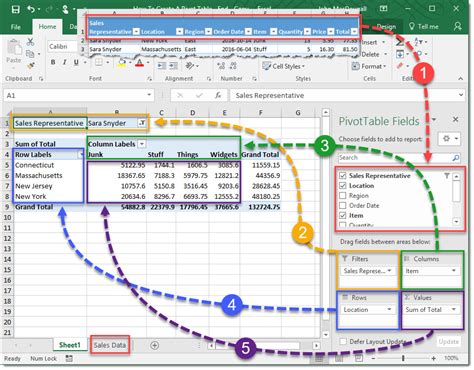
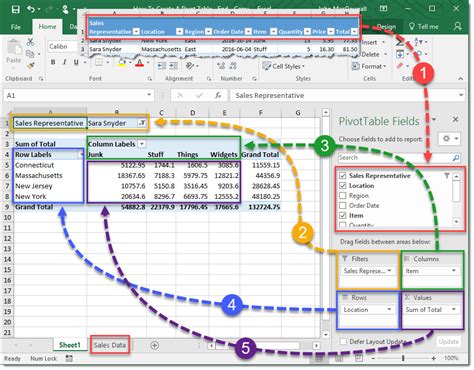
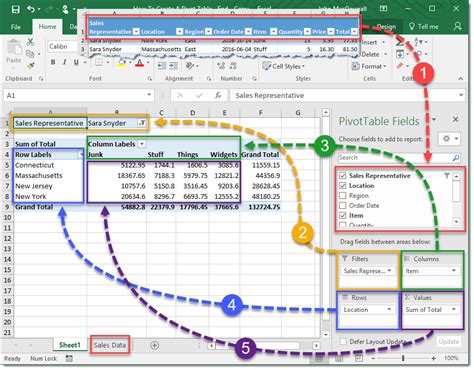
A pivot table consists of several components, including: * Row Labels: The fields that are used to create the rows of the pivot table * Column Labels: The fields that are used to create the columns of the pivot table * Values: The fields that are used to calculate the values in the pivot table * Filters: The fields that are used to filter the data in the pivot table
Editing a Pivot Table
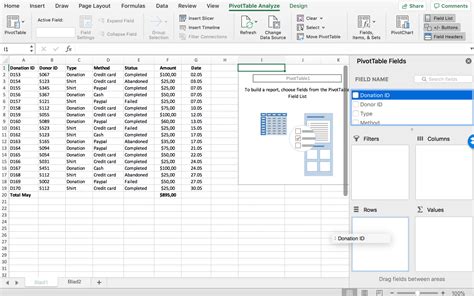
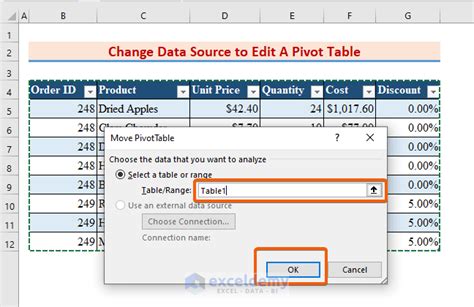
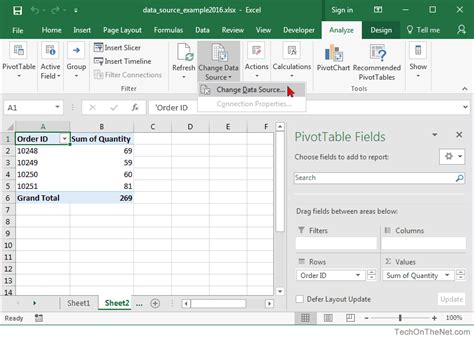
To edit a pivot table, you can follow these steps: * Update the data source: If the data source for the pivot table has changed, you can update the pivot table to reflect the new data by going to the Analyze tab and clicking on Refresh * Change the layout: You can change the layout of the pivot table by dragging and dropping fields from the PivotTable Fields pane to the Row Labels, Column Labels, or Values areas * Apply filters: You can apply filters to the pivot table by selecting the field you want to filter and then selecting the filter criteria from the PivotTable Fields pane * Perform calculations: You can perform calculations on the data in the pivot table by using the Value Field Settings dialog box
Tips for Editing Pivot Tables
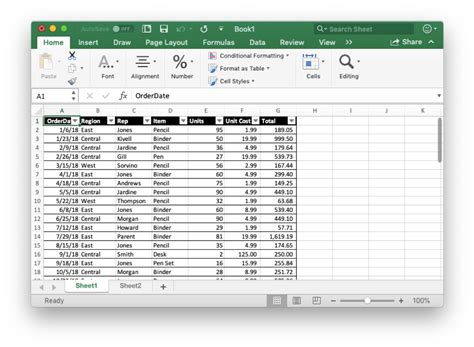
Here are some tips for editing pivot tables: * Use the PivotTable Fields pane: The PivotTable Fields pane is a powerful tool for editing pivot tables. You can use it to drag and drop fields, apply filters, and perform calculations. * Use the Analyze tab: The Analyze tab provides a range of tools for editing pivot tables, including the ability to refresh the data, change the layout, and apply filters. * Use the Value Field Settings dialog box: The Value Field Settings dialog box provides a range of options for performing calculations on the data in the pivot table.
📝 Note: When editing a pivot table, it's a good idea to make a copy of the original data source in case you need to revert back to the original data.
Common Pitfalls to Avoid When Editing Pivot Tables
Here are some common pitfalls to avoid when editing pivot tables: * Changing the data source: Be careful when changing the data source for a pivot table, as this can affect the accuracy of the data. * Applying filters incorrectly: Make sure to apply filters correctly, as incorrect filters can lead to inaccurate results. * Performing calculations incorrectly: Make sure to perform calculations correctly, as incorrect calculations can lead to inaccurate results.
Best Practices for Editing Pivot Tables

Here are some best practices for editing pivot tables: * Keep the data source up to date: Make sure to keep the data source up to date to ensure that the pivot table reflects the latest data. * Use meaningful field names: Use meaningful field names to make it easier to understand the data in the pivot table. * Test the pivot table: Test the pivot table to make sure it is working correctly and producing accurate results.
| Field Name | Field Description |
|---|---|
| Row Labels | The fields that are used to create the rows of the pivot table |
| Column Labels | The fields that are used to create the columns of the pivot table |
| Values | The fields that are used to calculate the values in the pivot table |
| Filters | The fields that are used to filter the data in the pivot table |
In summary, editing pivot tables in Excel can be a powerful way to analyze and summarize large datasets. By following the tips and best practices outlined in this article, you can create effective pivot tables that provide meaningful insights into your data. To recap, the key points to remember are to keep the data source up to date, use meaningful field names, and test the pivot table to ensure it is working correctly.
What is a pivot table in Excel?
+
A pivot table is a powerful tool in Excel that allows users to summarize and analyze large datasets with ease.
How do I create a pivot table in Excel?

+
To create a pivot table in Excel, select the cell where you want to place the pivot table, go to the Insert tab, click on PivotTable, choose the table or range of cells you want to use, and select the location where you want to place the pivot table.
What are the components of a pivot table?

+
A pivot table consists of several components, including Row Labels, Column Labels, Values, and Filters.