Determine P Value In Excel Easily
Introduction to P-Value in Statistics
When dealing with statistical tests, one of the key concepts to understand is the p-value. The p-value, or probability value, indicates whether the results of your experiment are due to chance or if they reflect a real effect. In this context, understanding how to determine the p-value in Excel is crucial for data analysis. Excel, being a powerful tool for statistical analysis, provides several methods to calculate the p-value, making it easier to interpret statistical test results.
Understanding P-Value
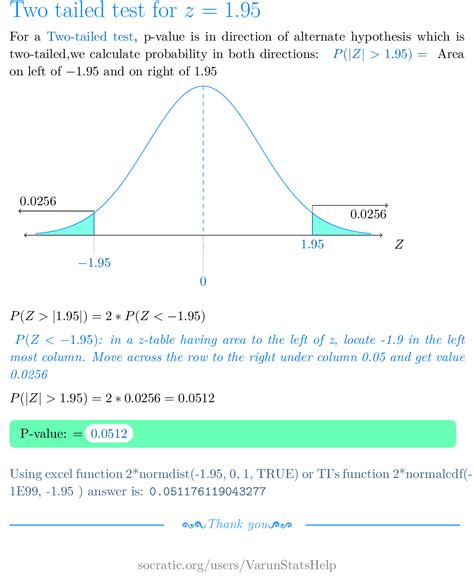
Before diving into how to calculate the p-value in Excel, it’s essential to understand what the p-value represents. The p-value is the probability of observing the results you have (or more extreme) given that the null hypothesis is true. The null hypothesis typically states that there is no effect or no difference. If the p-value is below a certain significance level (commonly set at 0.05), you reject the null hypothesis, suggesting that the observed effect is statistically significant.
Calculating P-Value in Excel
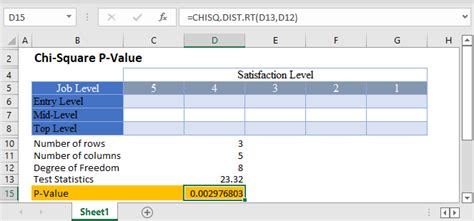
Excel offers several functions to calculate the p-value, depending on the type of statistical test you are performing. Here are a few common scenarios:
- For a t-test: If you’re comparing the means of two groups, you can use the
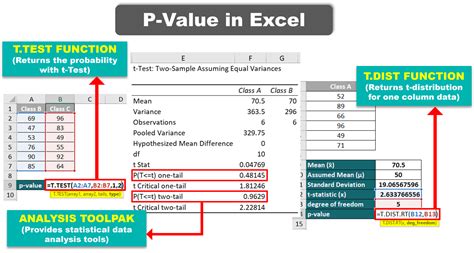
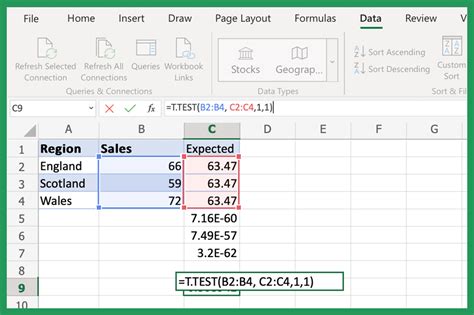
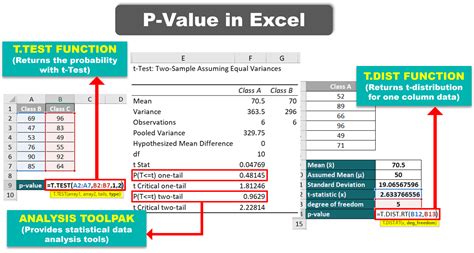
T.TESTfunction in Excel. This function returns the p-value, indicating the probability that the observed difference (or a more extreme difference) between the sample means would occur by chance if the true population means are equal. - For an ANOVA test: When comparing means across three or more groups, you can use the
ANOVAtool in Excel’s Data Analysis add-in. The output includes the p-value for the F-statistic, which helps determine if there is a significant difference between the group means. - For a regression analysis: In the context of linear regression, the p-value for each coefficient can be found in the coefficients table output when using Excel’s regression tool. This p-value indicates the probability of observing the coefficient (or a more extreme value) assuming that the true coefficient is zero.
Step-by-Step Guide to Calculate P-Value in Excel
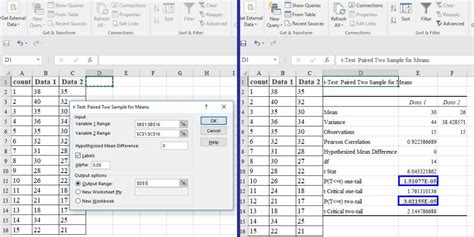
Here’s a step-by-step guide to calculating the p-value for a t-test, as it’s one of the most common statistical tests:
- Prepare Your Data: Ensure your data is organized into two columns, one for each group you’re comparing.
- Access the T.TEST Function:
- Click on a cell where you want the p-value to appear.
- Type
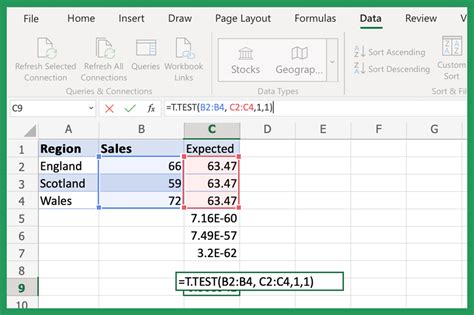
=T.TEST(and select the first range of data, then the second range, the tails (1 for a one-tailed test, 2 for a two-tailed test), and type). - For example:
=T.TEST(A1:A10, B1:B10, 2, 2).
- Interpret the Result: The function will return the p-value. Compare this value to your chosen significance level (usually 0.05). If the p-value is less than 0.05, you reject the null hypothesis, indicating a statistically significant difference between the groups.
Using Excel’s Data Analysis Add-in for ANOVA
For an ANOVA test, you’ll need to use Excel’s Data Analysis add-in:
- Enable the Data Analysis Add-in: Go to File > Options > Add-ins, and check “Analysis ToolPak”.
- Prepare Your Data: Organize your data into columns, each representing a group.
- Run ANOVA:
- Go to Data > Data Analysis > ANOVA: Single Factor.
- Select your data range, including headers, and choose the output range.
- Click OK.
- Interpret the P-Value: In the output table, look for the “P-value” under the ANOVA section. This value indicates the probability of observing the F-statistic (or a more extreme value) assuming that the true means of the groups are equal.
Important Considerations
- Assumptions: Always check the assumptions of the statistical test you’re using. For example, the t-test assumes normality and equal variances. - Interpretation: The p-value does not indicate the size or importance of the effect. For this, you need to look at the effect size and confidence intervals.
📝 Note: It's crucial to understand the context and assumptions of the statistical tests you're performing to correctly interpret the p-value.
Enhancing Readability with Visual Aids
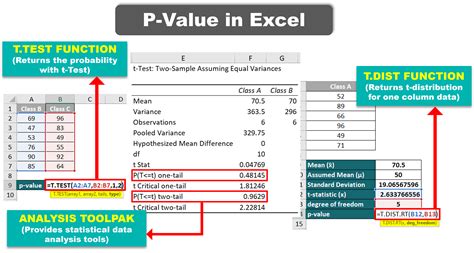
Visual aids like tables and images can significantly enhance the readability of your statistical analysis reports. For instance, a table summarizing the results of your t-test or ANOVA can make it easier for readers to quickly grasp the findings, including the p-value.
| Test | P-Value | Significance |
|---|---|---|
| T-Test | 0.01 | Statistically Significant |
| ANOVA | 0.05 | Statistically Significant |

In summary, determining the p-value in Excel is a straightforward process that can be accomplished using built-in functions like T.TEST for t-tests or the ANOVA tool in the Data Analysis add-in for analysis of variance. Understanding and correctly interpreting the p-value is essential for drawing meaningful conclusions from your data analysis. By following the steps outlined and considering the assumptions and limitations of statistical tests, you can effectively use Excel to calculate and interpret p-values, enhancing your data analysis capabilities.
What does the p-value indicate in statistical tests?

+
The p-value indicates the probability of observing the results you have (or more extreme) given that the null hypothesis is true. It helps determine if the observed effects are due to chance or if they are statistically significant.
How do I calculate the p-value in Excel for a t-test?
+
You can calculate the p-value for a t-test in Excel using the T.TEST function, which requires the ranges of the two groups you’re comparing, the number of tails (1 for one-tailed, 2 for two-tailed), and the type of test (1 for paired, 2 for unpaired, 3 for unpaired with unequal variances).
What is the significance level, and how does it relate to the p-value?

+
The significance level (commonly set at 0.05) is the threshold below which the p-value must fall for the results to be considered statistically significant. If the p-value is less than the significance level, you reject the null hypothesis, indicating that the observed effects are statistically significant.


