Calculate Uncertainty In Excel
Introduction to Calculating Uncertainty in Excel
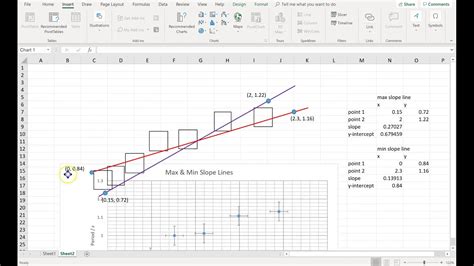
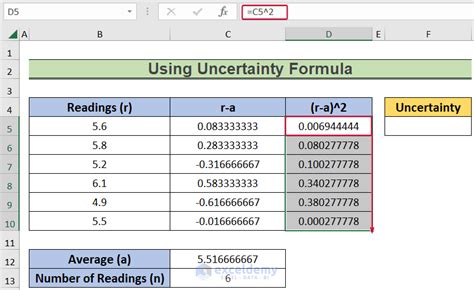
When working with data in Excel, it’s essential to consider the uncertainty associated with your measurements. Uncertainty can arise from various sources, such as instrument limitations, human error, or sampling variability. In this article, we’ll explore how to calculate uncertainty in Excel using various methods and functions.
Understanding Types of Uncertainty

There are two primary types of uncertainty: aleatory uncertainty and epistemic uncertainty. Aleatory uncertainty refers to the inherent randomness or variability in a system, while epistemic uncertainty arises from a lack of knowledge or understanding about the system. In Excel, we can calculate uncertainty using statistical methods, such as standard deviation, variance, and confidence intervals.
Calculating Standard Deviation and Variance
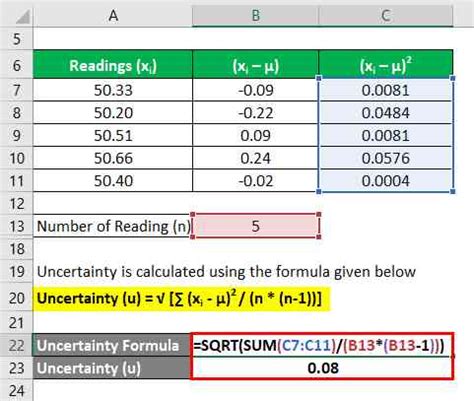
The standard deviation (SD) and variance are common measures of uncertainty. To calculate SD and variance in Excel, you can use the following functions: * STDEV: calculates the standard deviation of a dataset * VAR: calculates the variance of a dataset * STDEV.S: calculates the sample standard deviation * VAR.S: calculates the sample variance
For example, suppose you have a dataset of exam scores in cells A1:A10. To calculate the standard deviation, you can use the formula: =STDEV(A1:A10)
Calculating Confidence Intervals

Confidence intervals provide a range of values within which a population parameter is likely to lie. In Excel, you can calculate confidence intervals using the CONFIDENCE function. The syntax for this function is:
CONFIDENCE(alpha, standard_dev, size), where:
* alpha is the significance level (e.g., 0.05)
* standard_dev is the standard deviation of the dataset
* size is the sample size
For example, suppose you want to calculate the 95% confidence interval for a dataset with a standard deviation of 2.5 and a sample size of 20. You can use the formula: =CONFIDENCE(0.05, 2.5, 20)
Using the NORMDIST Function

The NORMDIST function in Excel calculates the cumulative distribution function (CDF) of the normal distribution. You can use this function to calculate uncertainty by determining the probability of a value falling within a certain range. The syntax for this function is:
NORMDIST(x, mean, standard_dev, cumulative), where:
* x is the value for which you want to calculate the probability
* mean is the mean of the dataset
* standard_dev is the standard deviation of the dataset
* cumulative is a logical value indicating whether to calculate the cumulative probability (TRUE) or the probability density function (FALSE)
For example, suppose you want to calculate the probability of a value falling within 1 standard deviation of the mean. You can use the formula: =NORMDIST(1, 0, 1, TRUE)
Calculating Uncertainty Using Monte Carlo Simulations

Monte Carlo simulations are a powerful tool for calculating uncertainty in complex systems. In Excel, you can use the RAND function to generate random numbers and simulate uncertainty. For example, suppose you want to simulate the uncertainty associated with a stock price. You can use the formula:
=RAND() * 10 + 50, where 10 is the standard deviation and 50 is the mean.
📝 Note: When using Monte Carlo simulations, it's essential to run multiple iterations to ensure accurate results.
Using Add-Ins and Macros
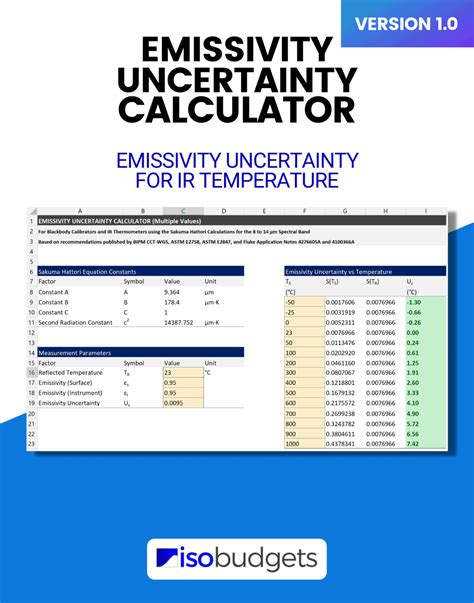
Excel add-ins and macros can also be used to calculate uncertainty. For example, the Analysis ToolPak add-in provides functions for calculating statistical measures, including standard deviation and variance. You can also create custom macros to perform complex uncertainty calculations.
| Function | Description |
|---|---|
| STDEV | Calculates the standard deviation of a dataset |
| VAR | Calculates the variance of a dataset |
| CONFIDENCE | Calculates the confidence interval for a dataset |
| NORMDIST | Calculates the cumulative distribution function of the normal distribution |

In summary, calculating uncertainty in Excel involves using various statistical functions and methods, such as standard deviation, variance, confidence intervals, and Monte Carlo simulations. By understanding these concepts and using the right functions, you can effectively quantify and manage uncertainty in your data.
To recap, the key points to take away are: * Understanding the types of uncertainty and their sources * Using statistical functions, such as STDEV and VAR, to calculate uncertainty * Calculating confidence intervals using the CONFIDENCE function * Using the NORMDIST function to calculate cumulative distribution functions * Utilizing Monte Carlo simulations to model complex uncertainty
What is the difference between aleatory and epistemic uncertainty?
+
Aleatory uncertainty refers to the inherent randomness or variability in a system, while epistemic uncertainty arises from a lack of knowledge or understanding about the system.
How do I calculate standard deviation in Excel?

+
You can calculate standard deviation in Excel using the STDEV function. The syntax is: =STDEV(dataset), where dataset is the range of cells containing the data.
What is the purpose of the CONFIDENCE function in Excel?
+
The CONFIDENCE function calculates the confidence interval for a dataset, providing a range of values within which a population parameter is likely to lie.


