5 Ways To Calculate IQR
Introduction to Interquartile Range (IQR)
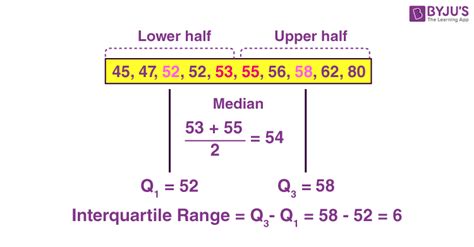
The Interquartile Range (IQR) is a measure of variability, based on dividing a data set into quartiles. Quartiles divide a rank-ordered data set into four equal parts. The values that separate these parts are known as the first quartile (Q1), the median (which is also the second quartile, Q2), and the third quartile (Q3). The IQR is calculated as the difference between the third quartile and the first quartile, i.e., IQR = Q3 - Q1. It is a useful metric for describing the spread of data and can be particularly useful in identifying outliers.
Understanding the Importance of IQR

The IQR is a valuable statistic because it is less affected by outliers compared to the range (which is the difference between the highest and lowest values in the dataset). This makes it a more robust measure of variability for many types of data. Furthermore, the IQR can be used to detect outliers in a dataset, with values being considered as outliers if they fall below Q1 - 1.5*IQR or above Q3 + 1.5*IQR.
5 Ways to Calculate IQR

There are multiple methods and tools to calculate the IQR, depending on the context and the tools available. Here are five common ways to calculate IQR:
- Manual Calculation: This involves sorting the data and then finding the median of the lower half (Q1) and the upper half (Q3) of the data. The difference between Q3 and Q1 gives the IQR.
- Using a Statistical Calculator: Many scientific calculators have built-in functions to calculate statistical measures, including quartiles and IQR. This can be a quick and efficient method for small datasets.
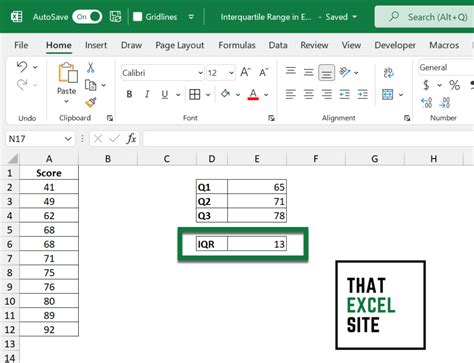
- Microsoft Excel: Excel provides functions to calculate quartiles and thus IQR. The
QUARTILEfunction can be used to find Q1 and Q3, and then the IQR can be calculated by subtracting Q1 from Q3. - Python Programming: Python libraries like NumPy and Pandas offer straightforward ways to calculate IQR. For example, the
numpy.percentilefunction can be used to find the 25th and 75th percentiles (which correspond to Q1 and Q3), and then the IQR can be calculated. - R Programming: R is a powerful statistical programming language that includes functions for calculating quartiles and IQR directly. The
quantilefunction can be used to find Q1 and Q3, and the IQR can be calculated from these values.
Step-by-Step Manual Calculation of IQR
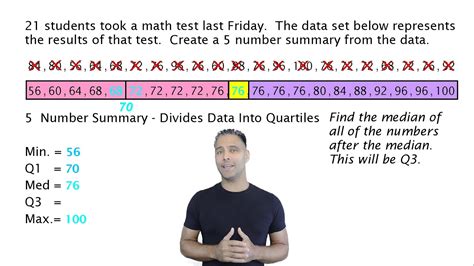
To manually calculate the IQR, follow these steps: - Sort the data in ascending order. - Find the median (Q2) of the dataset. - Find the median of the lower half of the data (which is Q1). - Find the median of the upper half of the data (which is Q3). - Calculate the IQR by subtracting Q1 from Q3.
📝 Note: When the dataset has an even number of entries, the median (Q2) is the average of the two middle numbers. Similarly, when calculating Q1 or Q3, if the subset of data has an even number of entries, the median of that subset will be the average of the two middle numbers.
Example of Calculating IQR

Consider a dataset of exam scores: 85, 90, 78, 92, 88, 76, 95, 89. 1. Sort the data: 76, 78, 85, 88, 89, 90, 92, 95. 2. Find Q1 (median of the lower half: 76, 78, 85): The average of 76 and 78 is not needed since we are looking for the median of the lower half which includes 76, 78, and 85. Thus, Q1 = 78. 3. Find Q3 (median of the upper half: 88, 89, 90, 92, 95): Since there are an odd number of values in the upper half, Q3 is the middle value, which is 90. 4. Calculate IQR: IQR = Q3 - Q1 = 90 - 78 = 12.
Using IQR to Identify Outliers

Once the IQR is calculated, it can be used to identify outliers. Any data point that is less than Q1 - 1.5*IQR or greater than Q3 + 1.5*IQR is considered an outlier. Using the example above: - Q1 - 1.5*IQR = 78 - 1.5*12 = 78 - 18 = 60 - Q3 + 1.5*IQR = 90 + 1.5*12 = 90 + 18 = 108 Any score below 60 or above 108 would be considered an outlier.
To further illustrate the concept and its application, consider the following table that summarizes the key statistics for a different dataset:
| Statistic | Value |
|---|---|
| Q1 | 20 |
| Q3 | 80 |
| IQR | 60 |
| Lower Bound | Q1 - 1.5*IQR = -40 |
| Upper Bound | Q3 + 1.5*IQR = 140 |

In this example, any value below -40 or above 140 would be considered an outlier.
As we’ve explored the different methods of calculating IQR and its application in identifying outliers, it’s clear that understanding and applying this concept can significantly enhance data analysis and interpretation. Whether through manual calculation, statistical software, or programming languages, the ability to calculate and apply IQR is a fundamental skill in statistics and data science.
The key takeaways from this discussion include the importance of IQR as a measure of variability, its calculation through various methods, and its use in identifying outliers. By mastering these concepts, individuals can better analyze and understand complex datasets, making informed decisions based on data-driven insights.
In summary, the Interquartile Range is a versatile and powerful tool in statistical analysis, offering a robust method for assessing data spread and identifying outliers. Its calculation and application are straightforward, whether performed manually, through software, or via programming. As such, it remains an essential component of any data analysis toolkit, facilitating deeper insights into the characteristics and behaviors of datasets across various disciplines.
What is the Interquartile Range (IQR) used for?
+
The Interquartile Range (IQR) is used to measure the variability of a dataset. It is the difference between the third quartile (Q3) and the first quartile (Q1) and is useful for identifying outliers and understanding the spread of data.
How do you calculate the IQR manually?

+
To calculate the IQR manually, first, sort the data in ascending order. Then, find the first quartile (Q1), which is the median of the lower half of the data, and the third quartile (Q3), which is the median of the upper half. The IQR is the difference between Q3 and Q1.
What is considered an outlier based on the IQR?

+
Data points that fall below Q1 - 1.5*IQR or above Q3 + 1.5*IQR are considered outliers. These values are far enough away from the rest of the data to be considered unusual or not part of the main distribution.
Can IQR be calculated using programming languages?

+
Yes, IQR can be calculated using programming languages such as Python and R. These languages have built-in functions and libraries (like NumPy and Pandas for Python, and various packages for R) that make it easy to calculate quartiles and IQR.
Why is IQR a more robust measure of variability than the range?

+
IQR is more robust than the range because it is less affected by outliers. The range is the difference between the highest and lowest values, which can be heavily influenced by extreme outliers. IQR, focusing on the middle 50% of the data, provides a better representation of the data’s spread without being skewed by outliers.


