Calculate P-Value in Excel
Introduction to P-Value Calculation in Excel

When working with statistical data in Excel, calculating the p-value is a crucial step in hypothesis testing. The p-value, or probability value, is a key concept in statistics that helps determine the significance of the results. In this article, we will explore how to calculate the p-value in Excel, including the different methods and formulas used.
Understanding P-Value

The p-value is a measure of the probability of observing the results of an experiment or study, assuming that the null hypothesis is true. It is a number between 0 and 1 that indicates the strength of evidence against the null hypothesis. A small p-value (typically less than 0.05) indicates that the results are statistically significant, while a large p-value indicates that the results are not significant.
Methods for Calculating P-Value in Excel
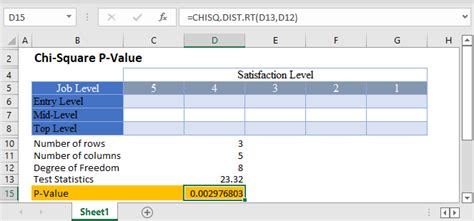
There are several methods for calculating the p-value in Excel, including:
- Using the TDIST function
- Using the TTEST function
- Using the ZTEST function
- Using the CHITEST function
Each of these methods will be discussed in detail, along with examples and formulas.
Using the TDIST Function

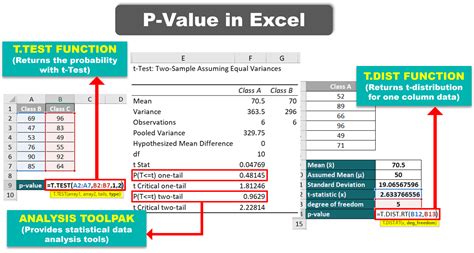
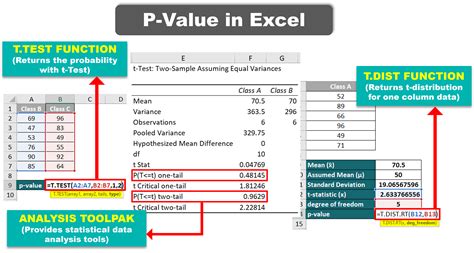
The TDIST function in Excel calculates the probability of a given t-value, which can be used to determine the p-value. The syntax for the TDIST function is:
TDIST(x, df, tails)
Where: - x is the t-value - df is the degrees of freedom - tails is the number of tails (1 for one-tailed test, 2 for two-tailed test)
For example, to calculate the p-value for a t-value of 2.5 with 10 degrees of freedom, using a two-tailed test:
=TDIST(2.5, 10, 2)
This formula returns the probability of observing a t-value of 2.5 or more extreme, assuming a two-tailed test.
Using the TTEST Function

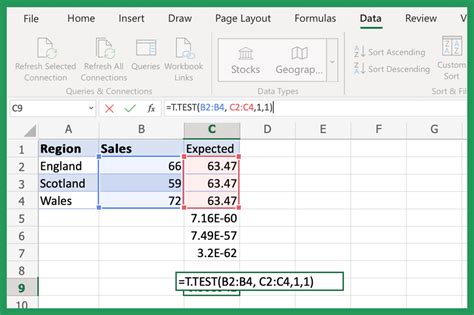
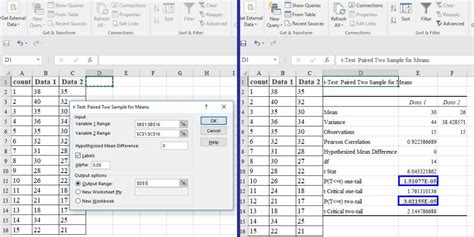
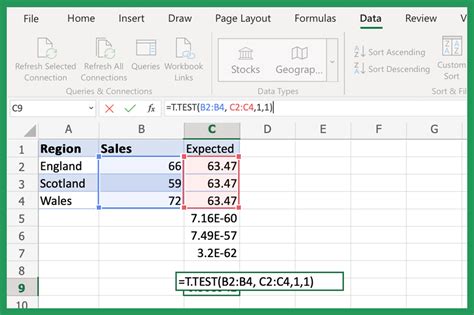
The TTEST function in Excel performs a two-sample t-test and returns the p-value. The syntax for the TTEST function is:
TTEST(array1, array2, tails, type)
Where: - array1 is the first sample - array2 is the second sample - tails is the number of tails (1 for one-tailed test, 2 for two-tailed test) - type is the type of test (1 for paired test, 2 for unpaired test)
For example, to perform a two-sample t-test on two arrays of data, using a two-tailed test and an unpaired test:
=TTEST(A1:A10, B1:B10, 2, 2)
This formula returns the p-value for the t-test.
Using the ZTEST Function

The ZTEST function in Excel performs a z-test and returns the p-value. The syntax for the ZTEST function is:
ZTEST(x, μ, σ, tails)
Where: - x is the sample mean - μ is the population mean - σ is the population standard deviation - tails is the number of tails (1 for one-tailed test, 2 for two-tailed test)
For example, to perform a z-test on a sample mean of 25, with a population mean of 20 and a population standard deviation of 5, using a two-tailed test:
=ZTEST(25, 20, 5, 2)
This formula returns the p-value for the z-test.
Using the CHITEST Function
The CHITEST function in Excel performs a chi-squared test and returns the p-value. The syntax for the CHITEST function is:
CHITEST(actual_range, expected_range)
Where: - actual_range is the range of actual frequencies - expected_range is the range of expected frequencies
For example, to perform a chi-squared test on two ranges of frequencies:
=CHITEST(A1:A10, B1:B10)
This formula returns the p-value for the chi-squared test.
Interpreting P-Value Results

Once the p-value has been calculated, it can be interpreted to determine the significance of the results. A small p-value (typically less than 0.05) indicates that the results are statistically significant, while a large p-value indicates that the results are not significant.
The following table summarizes the common p-value thresholds:
| P-Value Threshold | Interpretation |
|---|---|
| less than 0.01 | Highly significant |
| less than 0.05 | Significant |
| greater than 0.05 | Not significant |
📝 Note: The p-value threshold may vary depending on the research question and the level of significance required.
In conclusion, calculating the p-value in Excel is a crucial step in hypothesis testing, and there are several methods available, including the TDIST, TTEST, ZTEST, and CHITEST functions. By understanding how to calculate and interpret the p-value, researchers and analysts can make informed decisions about the significance of their results.
What is the p-value in statistics?
+
The p-value, or probability value, is a measure of the probability of observing the results of an experiment or study, assuming that the null hypothesis is true.
How do I calculate the p-value in Excel?
+
There are several methods for calculating the p-value in Excel, including using the TDIST, TTEST, ZTEST, and CHITEST functions.
What is the significance of the p-value in hypothesis testing?

+
The p-value is used to determine the significance of the results, with a small p-value (typically less than 0.05) indicating that the results are statistically significant, while a large p-value indicates that the results are not significant.