5 Ways Calculate MSE

Introduction to Mean Squared Error (MSE)

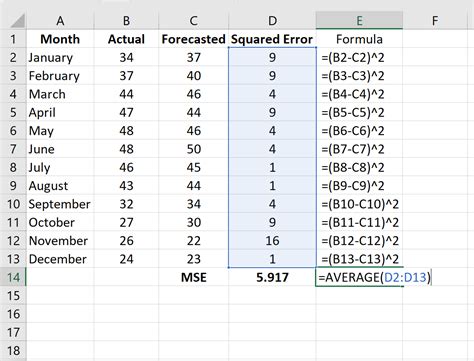
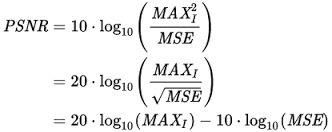
The Mean Squared Error (MSE) is a widely used metric in machine learning and statistics to measure the average squared difference between predicted and actual values. It is a crucial component in evaluating the performance of regression models. In this article, we will delve into the concept of MSE, its importance, and provide a step-by-step guide on how to calculate it using different methods.
Understanding the Concept of MSE

MSE is calculated as the average of the squared differences between predicted and actual values. It gives us an idea of how close our predictions are to the actual values. A lower MSE indicates better model performance, while a higher MSE suggests that the model is not doing a good job in predicting the values.
Importance of MSE

The importance of MSE lies in its ability to provide a quantitative measure of the model’s performance. It helps in: * Evaluating model performance: MSE is used to compare the performance of different models. * Hyperparameter tuning: MSE is used to tune hyperparameters to improve model performance. * Model selection: MSE is used to select the best model among different models.
5 Ways to Calculate MSE

Here are five different ways to calculate MSE:
- Manual Calculation: This involves calculating the squared differences between predicted and actual values and then taking the average.
- Formula: MSE = (1/n) * Σ(actual - predicted)^2
- Example: Suppose we have the following actual and predicted values: actual = [1, 2, 3, 4, 5], predicted = [1.1, 1.9, 3.2, 4.1, 5.1]. We can calculate the MSE as follows:
- (1.1 - 1)^2 + (1.9 - 2)^2 + (3.2 - 3)^2 + (4.1 - 4)^2 + (5.1 - 5)^2 = 0.01 + 0.01 + 0.04 + 0.01 + 0.01 = 0.08
- MSE = (1⁄5) * 0.08 = 0.016
- Using Python: We can use the mean_squared_error function from the sklearn.metrics module in Python to calculate MSE.
- Code: from sklearn.metrics import mean_squared_error; actual = [1, 2, 3, 4, 5]; predicted = [1.1, 1.9, 3.2, 4.1, 5.1]; mse = mean_squared_error(actual, predicted); print(mse)
- Using R: We can use the mean function in R to calculate MSE.
- Code: actual <- c(1, 2, 3, 4, 5); predicted <- c(1.1, 1.9, 3.2, 4.1, 5.1); mse <- mean((actual - predicted)^2); print(mse)
- Using Excel: We can use the AVERAGE and POWER functions in Excel to calculate MSE.
- Formula: =AVERAGE(POWER(actual - predicted, 2))
- Using MATLAB: We can use the mean function in MATLAB to calculate MSE.
- Code: actual = [1, 2, 3, 4, 5]; predicted = [1.1, 1.9, 3.2, 4.1, 5.1]; mse = mean((actual - predicted).^2); disp(mse)
Comparison of Different Methods

The different methods for calculating MSE have their own advantages and disadvantages. The manual calculation method is time-consuming and prone to errors, but it provides a clear understanding of the concept. The Python and R methods are faster and more efficient, but they require programming knowledge. The Excel method is easy to use, but it may not be suitable for large datasets. The MATLAB method is similar to the Python and R methods, but it is more commonly used in academic and research settings.
📝 Note: The choice of method depends on the individual's preference and the specific requirements of the project.
Advantages and Disadvantages of MSE

MSE has several advantages, including: * Easy to calculate: MSE is easy to calculate and understand. * Widely used: MSE is widely used in machine learning and statistics. * Provides a quantitative measure: MSE provides a quantitative measure of the model’s performance. However, MSE also has some disadvantages, including: * Sensitive to outliers: MSE is sensitive to outliers, which can affect the model’s performance. * Not suitable for classification problems: MSE is not suitable for classification problems, where the target variable is categorical.
| Method | Advantages | Disadvantages |
|---|---|---|
| Manual Calculation | Provides a clear understanding of the concept | Time-consuming and prone to errors |
| Python | Faster and more efficient | Requires programming knowledge |
| R | Faster and more efficient | Requires programming knowledge |
| Excel | Easy to use | May not be suitable for large datasets |
| MATLAB | Similar to Python and R methods | More commonly used in academic and research settings |

In summary, MSE is a widely used metric in machine learning and statistics to measure the average squared difference between predicted and actual values. It is essential to understand the concept of MSE and how to calculate it using different methods. The choice of method depends on the individual’s preference and the specific requirements of the project. MSE has several advantages, including ease of calculation and wide usage, but it also has some disadvantages, including sensitivity to outliers and not being suitable for classification problems.
As we have seen, there are different ways to calculate MSE, each with its own advantages and disadvantages. By understanding the concept of MSE and how to calculate it, we can improve our model’s performance and make better predictions.
In final thoughts, it is crucial to carefully evaluate the performance of machine learning models using metrics like MSE to ensure that they are making accurate predictions. By doing so, we can build more reliable and efficient models that can be used in a variety of applications.
What is the formula for calculating MSE?

+
The formula for calculating MSE is: MSE = (1/n) * Σ(actual - predicted)^2
What are the advantages of using MSE?

+
MSE is easy to calculate and understand, widely used in machine learning and statistics, and provides a quantitative measure of the model’s performance.
What are the disadvantages of using MSE?

+
MSE is sensitive to outliers and not suitable for classification problems.