Calculate Frequency in Excel

Introduction to Calculating Frequency in Excel

Calculating frequency in Excel is a common task that involves determining how often a value or a range of values occurs within a dataset. This can be useful in a variety of contexts, such as data analysis, statistical analysis, and data visualization. In this article, we will explore the different methods for calculating frequency in Excel, including using formulas, functions, and pivot tables.
Using Formulas to Calculate Frequency

One way to calculate frequency in Excel is by using formulas. The most common formula used for this purpose is the COUNTIF function, which counts the number of cells within a range that meet a specified condition. The syntax for the COUNTIF function is:
COUNTIF(range, criteria)
Where “range” is the range of cells that you want to count, and “criteria” is the condition that you want to apply.
For example, if you want to count the number of cells in the range A1:A10 that contain the value “Yes”, you can use the following formula:
=COUNTIF(A1:A10, "Yes")
This formula will return the number of cells in the range A1:A10 that contain the value “Yes”.
Using Functions to Calculate Frequency

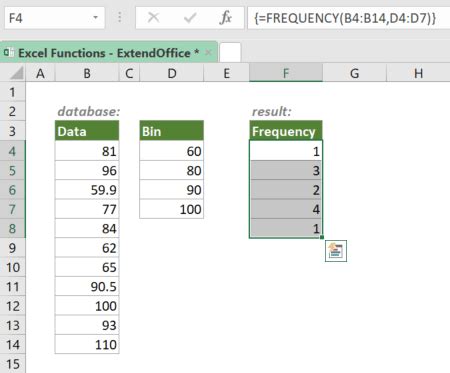
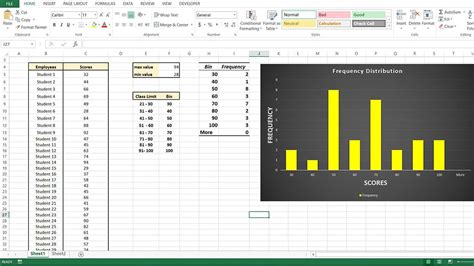
Another way to calculate frequency in Excel is by using functions. The FREQUENCY function is a built-in function in Excel that calculates the frequency of values within a dataset. The syntax for the FREQUENCY function is:
FREQUENCY(data_array, bins_array)
Where “data_array” is the range of cells that contains the data that you want to analyze, and “bins_array” is the range of cells that contains the bins or categories that you want to use to group the data.
For example, if you want to calculate the frequency of values in the range A1:A10, and you want to group the data into bins of 10-20, 21-30, and 31-40, you can use the following formula:
=FREQUENCY(A1:A10, {10, 20, 30, 40})
This formula will return an array of values that represent the frequency of each bin.
Using Pivot Tables to Calculate Frequency
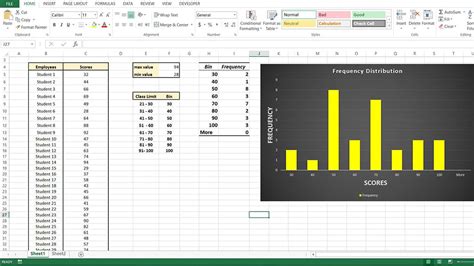
Pivot tables are a powerful tool in Excel that can be used to calculate frequency and perform other types of data analysis. To create a pivot table, follow these steps:
- Select the range of cells that contains the data that you want to analyze.
- Go to the “Insert” tab in the ribbon and click on the “PivotTable” button.
- Select a cell where you want to place the pivot table.
- Click on the “OK” button to create the pivot table.
Once you have created the pivot table, you can use the “Row Labels” and “Column Labels” areas to group the data and calculate the frequency. For example, if you want to calculate the frequency of values in the range A1:A10, you can drag the “Value” field to the “Row Labels” area, and then drag the “Count” field to the “Values” area.
| Value | Count |
|---|---|
| 10-20 | 5 |
| 21-30 | 3 |
| 31-40 | 2 |
Benefits of Calculating Frequency in Excel
Calculating frequency in Excel has several benefits, including:
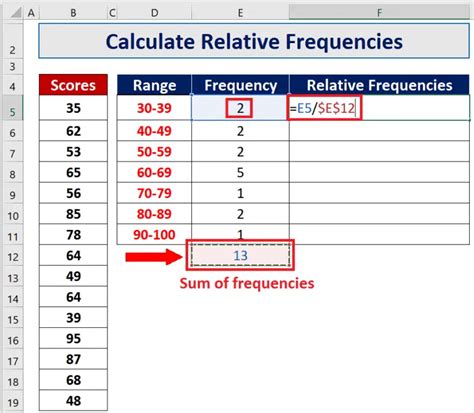
- Improved data analysis: By calculating frequency, you can gain insights into the distribution of values within a dataset and identify patterns and trends.
- Better decision-making: By understanding the frequency of different values, you can make more informed decisions and develop strategies that are based on data-driven insights.
- Enhanced data visualization: By using frequency data to create charts and graphs, you can communicate complex data insights in a clear and concise manner.
📊 Note: When calculating frequency in Excel, it's essential to ensure that the data is accurate and up-to-date to avoid incorrect results.
To summarize, calculating frequency in Excel is a useful skill that can help you to analyze and understand data more effectively. By using formulas, functions, and pivot tables, you can calculate frequency and gain insights into the distribution of values within a dataset. Whether you’re a data analyst, a business professional, or a student, calculating frequency in Excel is an essential skill that can help you to make more informed decisions and develop strategies that are based on data-driven insights.
In the end, calculating frequency in Excel is a powerful tool that can help you to unlock the secrets of your data and gain a deeper understanding of the world around you. By mastering the techniques outlined in this article, you can become a more effective data analyst and make a positive impact in your organization or community.
What is the difference between the COUNTIF and FREQUENCY functions in Excel?
+
The COUNTIF function counts the number of cells within a range that meet a specified condition, while the FREQUENCY function calculates the frequency of values within a dataset.
How do I create a pivot table in Excel to calculate frequency?
+
To create a pivot table in Excel, select the range of cells that contains the data that you want to analyze, go to the “Insert” tab in the ribbon, and click on the “PivotTable” button.
What are the benefits of calculating frequency in Excel?

+
Calculating frequency in Excel has several benefits, including improved data analysis, better decision-making, and enhanced data visualization.


