Calculate Cpk in Excel Easily
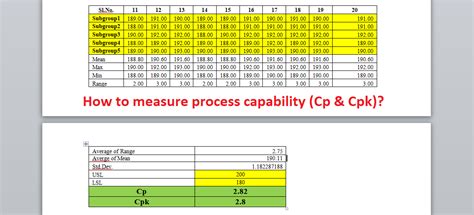
Introduction to Cpk Calculation
Calculating the Cpk (Capability Index) is a crucial step in understanding the capability of a process to produce output within specified limits. It’s a statistical measure that combines the concepts of process centering and process spread. The higher the Cpk value, the more capable the process is. In this blog post, we will explore how to calculate Cpk in Excel easily, step by step.
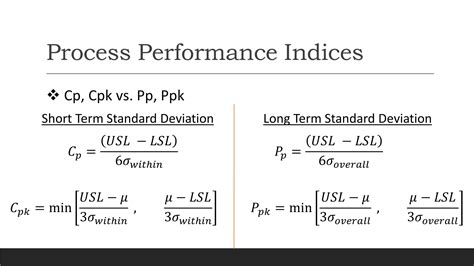
Understanding the Formula for Cpk
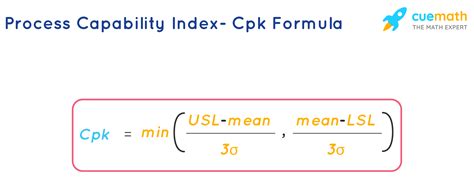
The formula for calculating Cpk involves the following components: - USL (Upper Specification Limit): The maximum allowable value for a process. - LSL (Lower Specification Limit): The minimum allowable value for a process. - Mean (μ): The average of the process data. - Sigma (σ): The standard deviation of the process data.
The formula for Cpk is: [ Cpk = min \left( \frac{USL - \mu}{3\sigma}, \frac{\mu - LSL}{3\sigma} \right) ]
Preparing Your Data in Excel
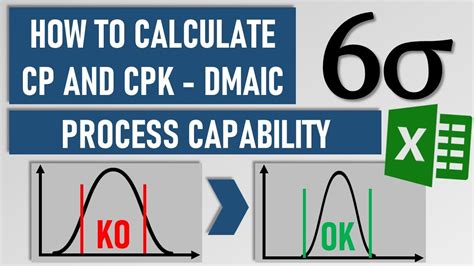
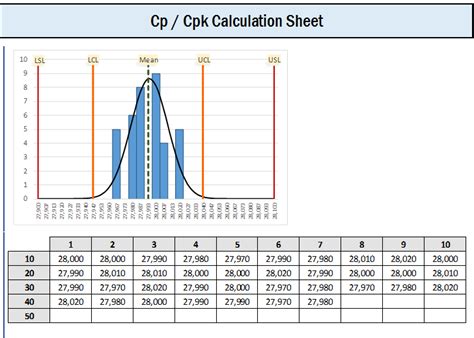
To calculate Cpk in Excel, you first need to prepare your data. This involves: - Collecting a sample of data from your process. - Calculating the mean (μ) and standard deviation (σ) of your data. - Knowing the USL and LSL for your process.
Here are the steps to calculate the mean and standard deviation in Excel:
1. Enter your data into a column.
2. Use the formula =AVERAGE(range) to calculate the mean, where range is the range of cells containing your data.
3. Use the formula =STDEV.S(range) to calculate the standard deviation.
Calculating Cpk in Excel
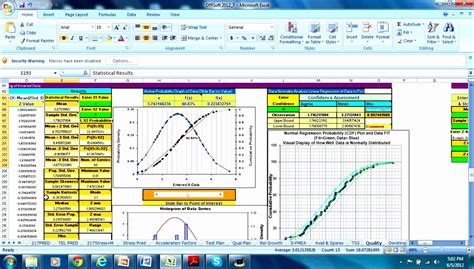
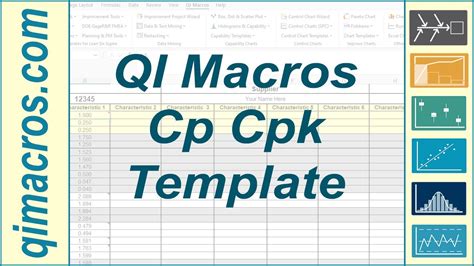
With your mean, standard deviation, USL, and LSL ready, you can calculate the Cpk using the formula provided earlier. Here’s how you can do it in Excel: 1. Enter the USL, LSL, mean, and standard deviation into separate cells. 2. Use the Cpk formula in a new cell, referencing the cells with your values.
For example, if: - USL is in cell A1, - LSL is in cell A2, - Mean (μ) is in cell A3, - Standard Deviation (σ) is in cell A4,
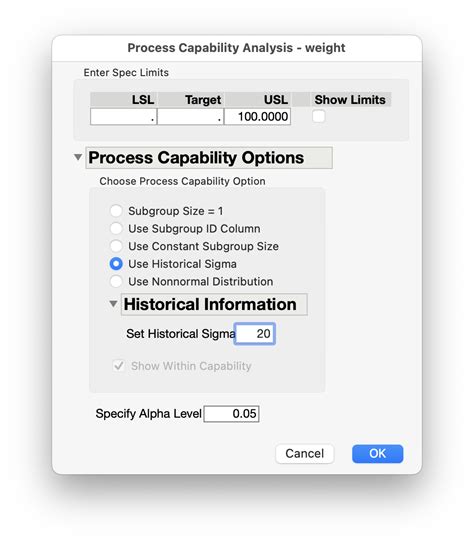
your formula might look like this: [ =MIN\left( \frac{A1-A3}{3*A4}, \frac{A3-A2}{3*A4} \right) ]
This formula calculates the Cpk value based on the minimum distance from the mean to either the USL or LSL, divided by 3 times the standard deviation.
Interpreting Cpk Values

- A Cpk value of 1 indicates that the process is just capable of meeting specifications. - Values greater than 1 indicate that the process is capable, with some margin to spare. - Values less than 1 indicate that the process is not capable of meeting specifications.
Example Table of Cpk Values and Their Interpretations
| Cpk Value | Interpretation |
|---|---|
| Less than 1 | Not capable |
| 1 | Just capable |
| Greater than 1 | Capable with margin |
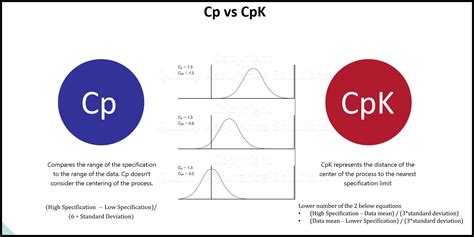
📝 Note: The choice of which formula to use (Cp or Cpk) depends on whether the process mean is centered between the specification limits. If the process is perfectly centered, Cp = Cpk. However, if there's a shift in the mean, Cpk is a more accurate measure of process capability.
Conclusion and Next Steps

Calculating Cpk in Excel is a straightforward process that involves understanding the formula, preparing your data, and using Excel to compute the Cpk value. With this capability index, you can assess the performance of your processes and identify areas for improvement. Remember, the goal is to achieve a Cpk value that indicates your process is not only meeting specifications but has a margin of safety to ensure consistent quality.
To further enhance your understanding and application of Cpk, consider the following steps: - Monitor and adjust: Continuously monitor your process’s Cpk value and make adjustments as necessary to improve its capability. - Invest in process improvement: If your process is not capable, identify the root causes and invest in improvements such as training, equipment upgrades, or process redesign. - Educate the team: Ensure that all team members understand the importance of Cpk and how it reflects on the process’s performance and quality.
What does a Cpk value of 1.33 indicate?
+
A Cpk value of 1.33 indicates that the process is capable with a good margin to spare, suggesting a high level of process capability and quality.
How often should Cpk be calculated?
+
Cpk should be calculated regularly, especially after any changes to the process, to ensure that the process remains capable and to identify any shifts in the mean or changes in variability.
Can Cpk be used for non-normal data?
+
While Cpk is typically used for normal data, there are transformations and alternative methods (like using the Box-Cox transformation) that can be applied to non-normal data to make it more suitable for Cpk analysis.


