Graphing Quadratic Functions Made Easy
Understanding Quadratic Functions

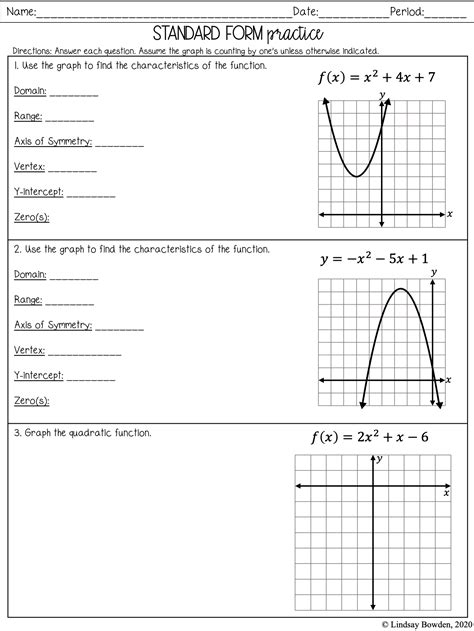
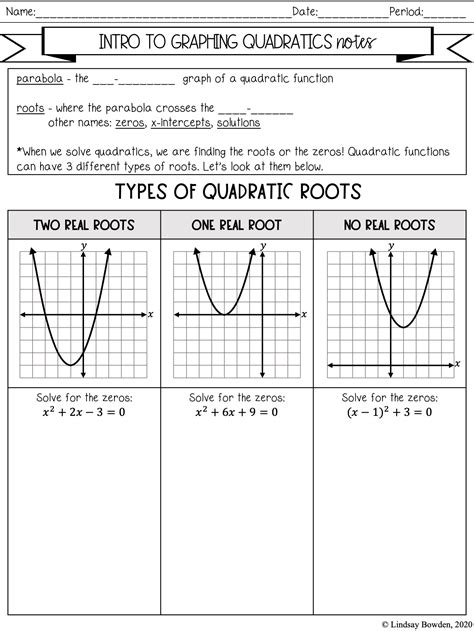
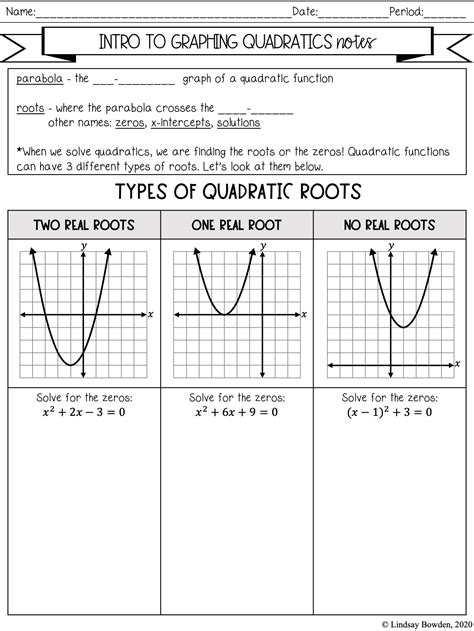
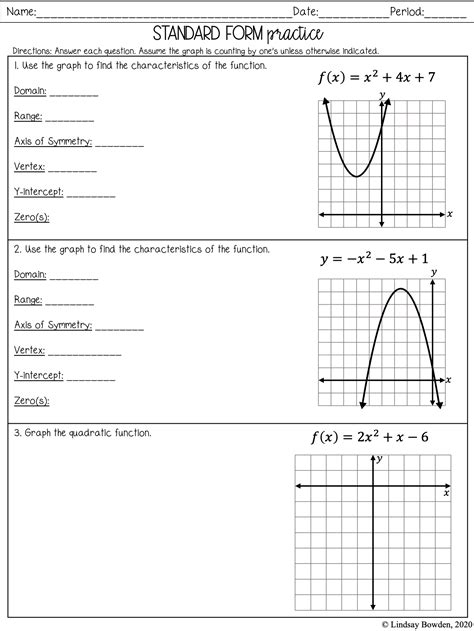
Quadratic functions are a fundamental concept in algebra and are used to model a wide range of real-world phenomena, from the trajectory of a thrown ball to the shape of a satellite dish. A quadratic function is a polynomial function of degree two, which means the highest power of the variable (usually x) is two. The general form of a quadratic function is:
f(x) = ax^2 + bx + c
where a, b, and c are constants, and a cannot be zero.
The Anatomy of a Quadratic Function

To graph a quadratic function, it’s essential to understand the different components of the function.
- a: The coefficient of the x^2 term, which determines the direction and width of the parabola. If a is positive, the parabola opens upwards; if a is negative, it opens downwards.
- b: The coefficient of the x term, which affects the position of the parabola’s vertex.
- c: The constant term, which determines the y-intercept of the parabola.
Graphing Quadratic Functions
Graphing a quadratic function can seem daunting, but it’s a straightforward process if you follow these steps:
Step 1: Determine the Vertex

The vertex of a parabola is the lowest or highest point on the graph, depending on the direction of the parabola. To find the vertex, use the formula:
x = -b / 2a
This will give you the x-coordinate of the vertex. To find the y-coordinate, plug the x-coordinate back into the original equation.
Step 2: Find the Y-Intercept
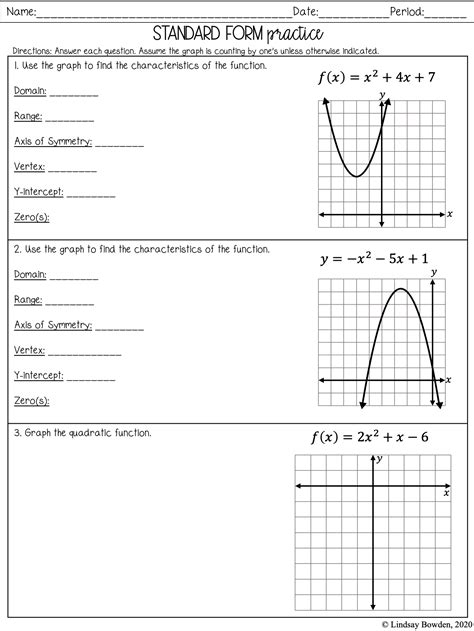
The y-intercept is the point where the parabola crosses the y-axis. To find the y-intercept, set x = 0 and solve for y.
Step 3: Plot Additional Points
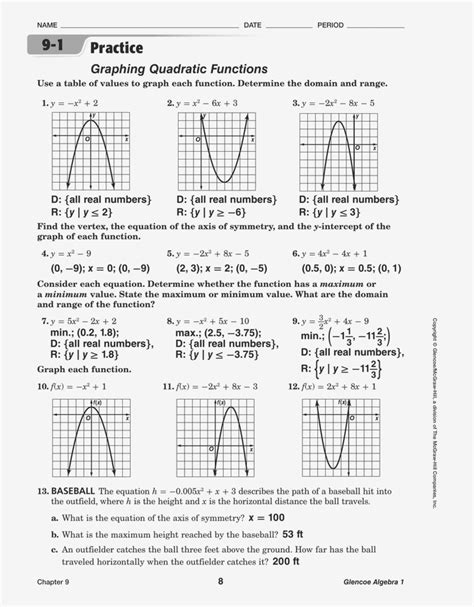
To get a sense of the parabola’s shape, plot additional points on either side of the vertex. You can use the equation to find the corresponding y-coordinates.
Step 4: Draw the Parabola
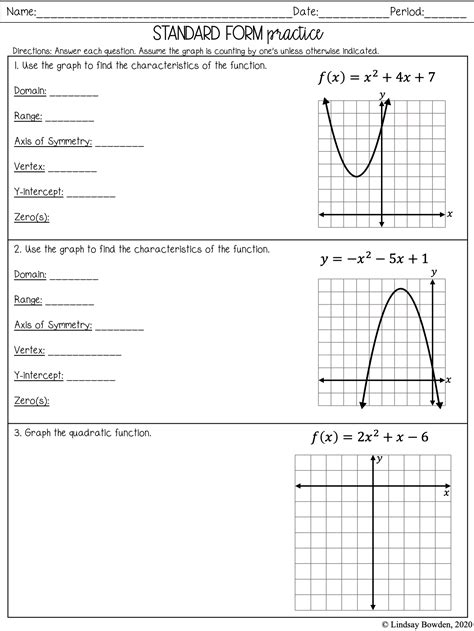
Using the vertex, y-intercept, and additional points, draw a smooth curve to represent the parabola.
📝 Note: Make sure to label the vertex, y-intercept, and any other significant points on the graph.
Example: Graphing a Quadratic Function
Let’s graph the quadratic function:
f(x) = x^2 + 4x + 4
Step 1: Determine the Vertex
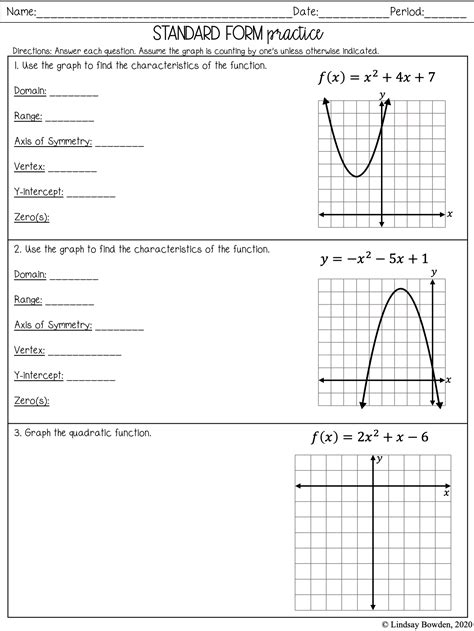
x = -b / 2a x = -4 / (2*1) x = -2
Now, plug x = -2 back into the original equation to find the y-coordinate:
f(-2) = (-2)^2 + 4(-2) + 4 f(-2) = 4 - 8 + 4 f(-2) = 0
So, the vertex is (-2, 0).
Step 2: Find the Y-Intercept
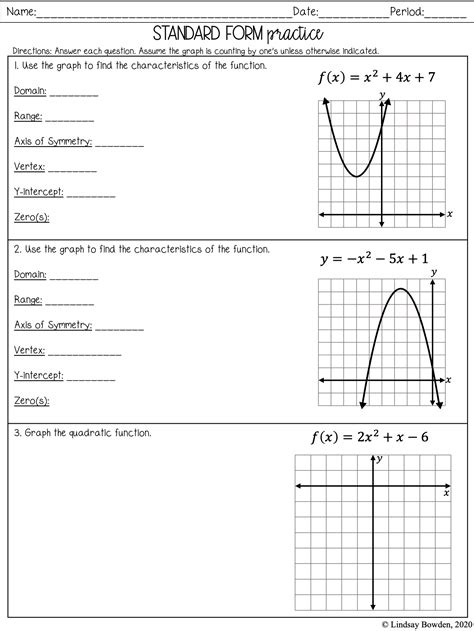
Set x = 0 and solve for y:
f(0) = 0^2 + 4(0) + 4 f(0) = 4
So, the y-intercept is (0, 4).
Step 3: Plot Additional Points
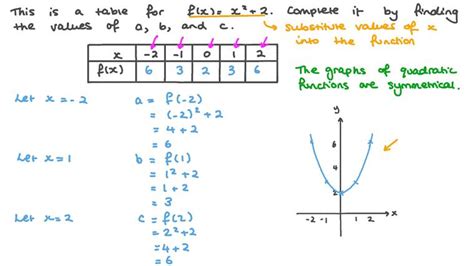
Let’s plot the points (x, f(x)) = (-3, f(-3)) and (x, f(x)) = (-1, f(-1)):
f(-3) = (-3)^2 + 4(-3) + 4 f(-3) = 9 - 12 + 4 f(-3) = 1
f(-1) = (-1)^2 + 4(-1) + 4 f(-1) = 1 - 4 + 4 f(-1) = 1
Step 4: Draw the Parabola
Using the vertex, y-intercept, and additional points, draw a smooth curve to represent the parabola.
Common Challenges and Solutions

- What if the parabola doesn’t open upwards or downwards? In this case, the parabola is a horizontal line, and the equation is of the form f(x) = c.
- What if the vertex is not on the graph? This can happen if the vertex is outside the visible range of the graph. You can try adjusting the x-axis limits or using a different graphing method.
- How do I graph a quadratic function with a large coefficient of x^2? In this case, the parabola will be very narrow and may not fit on the graph. You can try adjusting the x-axis limits or using a different graphing method.
Conclusion

Graphing quadratic functions is a fundamental skill in algebra, and with practice, you can become proficient in it. By following these steps and understanding the anatomy of a quadratic function, you can accurately graph any quadratic function. Remember to label significant points on the graph and adjust the x-axis limits as needed.
What is the difference between a quadratic function and a linear function?
+
A quadratic function is a polynomial function of degree two, while a linear function is a polynomial function of degree one. Quadratic functions have a parabolic shape, while linear functions have a straight line shape.
How do I determine the direction of a parabola?
+
The direction of a parabola is determined by the coefficient of the x^2 term. If the coefficient is positive, the parabola opens upwards; if the coefficient is negative, the parabola opens downwards.
What is the y-intercept of a quadratic function?
+The y-intercept of a quadratic function is the point where the parabola crosses the y-axis. To find the y-intercept, set x = 0 and solve for y.
Related Terms:
- Graphing Quadratic Functions Worksheet
- Desmos
- GeoGebra
- Symbolab
- Photomath
- Microsoft Math Solver


