Correlation vs. Quasi-Experiment: Worksheet Answers Revealed

In the world of research, statistics, and data analysis, understanding the differences between correlation and quasi-experiments is essential for making informed conclusions. This blog post will delve into the nuances of these research methodologies, offering insights into how they differ, their applications, and what they tell us about the relationships between variables.
Understanding Correlation

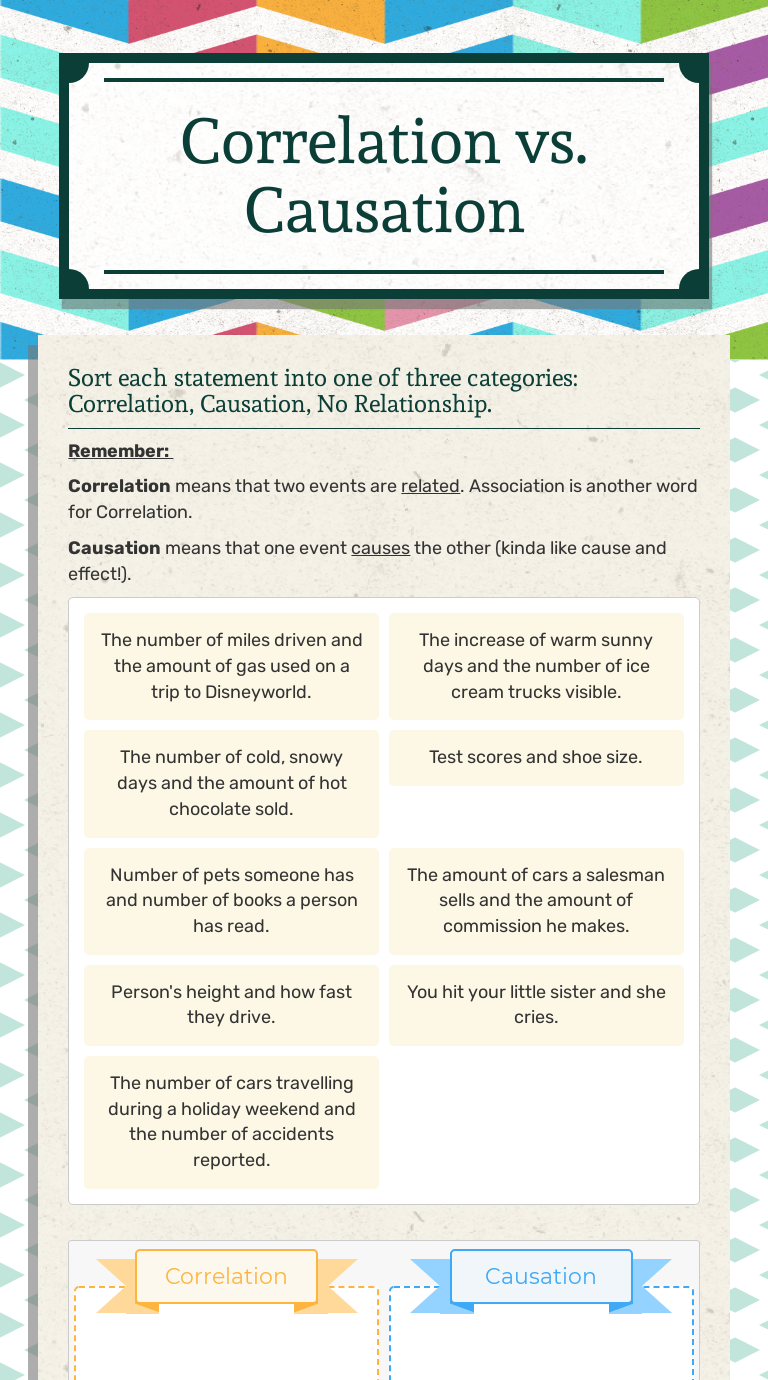
Correlation is a statistical measure that describes the size and direction of a relationship between two or more variables. It does not imply causation but simply indicates how strongly two or more sets of data tend to vary together. Here are the key points about correlation:
- Types of Correlation: Positive, negative, and zero. In positive correlation, variables move in the same direction, whereas in negative correlation, they move in opposite directions. Zero correlation indicates no relationship.
- Correlation Coefficients: These range from -1 to +1, where -1 indicates a perfect negative correlation, +1 a perfect positive correlation, and 0 no correlation at all.
- Pearson Correlation: Often used when variables are normally distributed, measuring linear relationships.
- Spearman Correlation: Suitable for data that does not meet normality assumptions, measuring monotonic relationships.
🔍 Note: Correlation does not prove causation. It’s possible for two variables to be correlated without one causing the other.
Exploring Quasi-Experiments

Quasi-experiments are designs where researchers aim to estimate a causal impact of an intervention or treatment but lack the ability to randomly assign participants to treatment groups. Here’s how they work:
- Lack of Randomization: Instead of random assignment, pre-existing groups (like schools or communities) are often used.
- Before-and-After Comparison: Often, measurements are taken before and after the intervention to infer changes due to the intervention.
- Control for Confounding Variables: Researchers attempt to control or measure other variables that might influence the outcome.
- Examples: Educational interventions in schools, policy changes in government settings, or natural experiments like a sudden change in law or policy.
Worksheet Answers

Let’s delve into typical questions found in worksheets comparing correlation with quasi-experiments:
1. What does a correlation coefficient of 0.72 indicate?

A correlation coefficient of 0.72 indicates a strong positive relationship between two variables. This means as one variable increases, the other tends to increase as well.
2. Is it possible for a quasi-experiment to show a causal relationship?

While quasi-experiments aim to infer causal effects, they do not provide the same level of proof as true experiments due to the lack of random assignment. However, with rigorous control for confounding variables, researchers can make reasonable causal inferences.
3. Compare correlation and quasi-experiment in terms of their design flexibility.

| Aspect | Correlation | Quasi-Experiment |
|---|---|---|
| Design Flexibility | High. Can analyze existing data sets to find relationships without any experimental manipulation. | Medium to Low. Researchers must identify or create comparison groups, but there is less control over variables compared to true experiments. |
| Causal Inference | Limited to none. It shows association, not causation. | Possible with careful design, though not as strong as true experiments. |
| Data Requirements | Pairwise data for variables of interest. | Time series or panel data, often requiring baseline and follow-up measures. |

💡 Note: Despite limitations, quasi-experiments can still offer valuable insights into potential causal relationships in real-world settings where true experimental design is impractical or unethical.
SEO Strategies for This Topic

To enhance the visibility of this topic in search engines, here are some SEO tips:
- Keyword Optimization: Use terms like “correlation vs. quasi-experiment”, “causal inference”, “correlation coefficient”, “quasi-experimental design” throughout your content.
- Content Structuring: Organize content with clear headings and subheadings that align with user search intent.
- Internal and External Links: Link to other relevant articles or academic resources within your site or to trusted external sources.
- Use of Images: Include diagrams showing correlation graphs or simple diagrams explaining quasi-experimental setups, using alt tags optimized with keywords.
Final Remarks

Correlation and quasi-experimental designs are both invaluable in their respective applications. While correlation provides insights into relationships between variables, quasi-experiments allow researchers to delve into potential causations in situations where experimental control is limited. Understanding these methods enriches our ability to interpret and act upon research findings, making us better informed about the world’s complexities.
Throughout this blog, we've explored the intricacies of both correlation and quasi-experiments, provided examples, compared their design elements, and suggested how to optimize content for SEO. These tools empower researchers and analysts to understand and communicate data effectively, keeping in mind the context and limitations of each approach.
Can correlation imply causation?

+
No, correlation alone does not imply causation. A correlation between two variables means that when one changes, the other tends to change, but it does not tell us why this happens or if one causes the other. There might be underlying factors, known as confounders, influencing both variables.
Why can’t we randomize in quasi-experiments?

+
Randomization in true experiments ensures that groups are equivalent in terms of all other variables except for the treatment. In quasi-experiments, randomization might be impractical, unethical, or impossible due to pre-existing groups or conditions, such as natural disasters or policy changes.
How can I validate findings from a quasi-experiment?

+
To validate findings from a quasi-experiment, you should control for as many confounding variables as possible, use matched comparison groups, perform statistical analysis to adjust for selection bias, replicate the study, and consider external validity by comparing results with other similar studies.