5 Cladogram Worksheet Answers: Simplified Guide

Cladograms, or phylogenetic trees, are essential tools in the world of biology that visually represent the evolutionary relationships among different species. They illustrate common ancestry and divergence, providing a structured understanding of how organisms are related. Cladograms are not just for students studying evolution; they're crucial for anyone interested in understanding the intricate web of life on Earth. Here's a simplified guide to help you understand and create cladograms using worksheet answers.
1. Understanding Cladograms

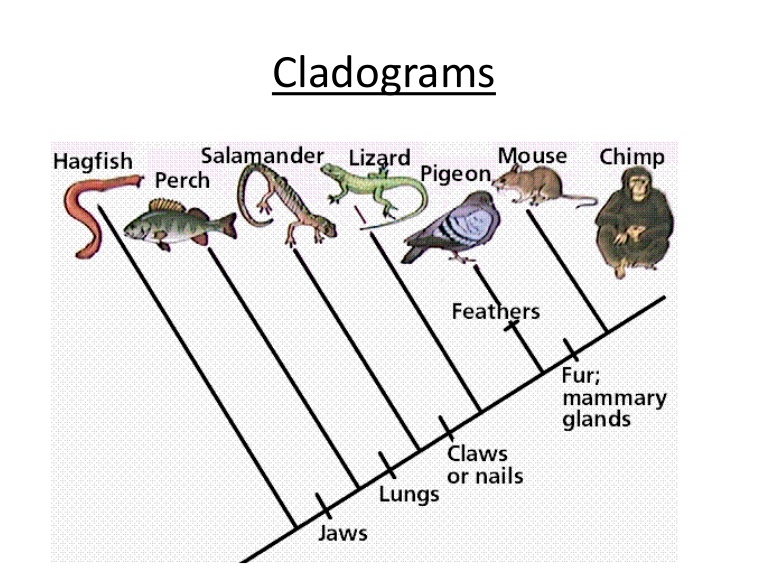
What is a Cladogram? A cladogram is a diagram showing how groups of organisms are related in terms of their evolutionary history. Each branch on a cladogram represents an evolutionary lineage, and where branches diverge, it signifies a shared ancestor from which the organisms split.
- Nodes: Points where branches split, indicating common ancestors.
- Branches: Lines connecting nodes, representing lineages over time.
- Tips: The end points of branches, representing current species or extinct lineages.
- Derived Characters: Characteristics that have evolved in specific groups and can be used to construct the cladogram.
2. Constructing Cladograms

To construct a cladogram:
- Gather Data: Collect information on traits for each species you wish to include. These traits should be heritable and represent evolutionary changes.
- Analyze Traits: Look for traits that are derived or ancestral. Derived traits (synapomorphies) are new characteristics that appear in the group you’re studying.
- Group Organisms: Organize species based on shared derived characters. If two species share a derived trait that a third does not, they are more closely related.
- Create Branches: Start with the outgroup, which has the most primitive or ancestral traits, and add branches as you add species with more derived traits.
💡 Note: Always choose traits that represent changes in a group, not random differences.
3. Example: Creating a Cladogram for Animals

Let’s look at an example to understand how to construct a cladogram:
| Species | Vertebrae | Jaws | Lungs | Amnion |
|---|---|---|---|---|
| Jellyfish | No | No | No | No |
| Shark | Yes | Yes | No | No |
| Frog | Yes | Yes | Yes | No |
| Bird | Yes | Yes | Yes | Yes |

From the data:
- The outgroup would be the jellyfish since it lacks all derived traits listed.
- Next, vertebrates share the derived trait of having vertebrae; thus, we place sharks, frogs, and birds on a branch together.
- Frogs and birds share jaws, a trait not present in jellyfish, leading to another split.
- Frogs, birds, and sharks share jaws and vertebrae, but only frogs and birds have lungs, forming another branch.
- The amnion, found only in birds among our list, creates the final divergence.
💡 Note: Remember, traits closer to the root of the cladogram are considered ancestral, and those near the tips, derived.
4. Reading and Interpreting Cladograms

Here’s how to interpret a cladogram:
- Proximity: Species placed closer to each other on the tree are more closely related.
- Node Levels: The level at which a node occurs indicates the age of the common ancestor.
- Derived Traits: Moving up the tree, derived traits are added. Nodes where traits appear are where these traits evolved.
5. Common Mistakes in Cladogram Construction

Here are some common errors to avoid:
- Using traits that do not represent evolutionary changes.
- Placing species together based on superficial resemblances rather than shared derived traits.
- Not considering the outgroup properly, which can lead to incorrect evolutionary relationships.
- Overlooking traits that might be ancestral in one group but derived in another.
Wrapping Up

Understanding and constructing cladograms is an integral part of evolutionary biology. These diagrams help clarify the relationships between species, providing insights into how life has diversified over time. By following the steps outlined in this guide, you can construct and interpret cladograms, enhancing your understanding of the evolutionary history of organisms. Remember, cladograms are dynamic; as new information becomes available, they might require updates or reevaluation. The journey through the evolutionary web of life is an ongoing learning experience, where cladograms serve as crucial navigational tools.
What is the difference between an ancestral trait and a derived trait?

+
An ancestral trait is a characteristic inherited from a distant ancestor that all descendants share, representing a more ancient evolutionary origin. A derived trait or synapomorphy, is a new characteristic that has evolved in a specific lineage and can be used to distinguish that group from others.
How do you know which organism to use as an outgroup?

+
The outgroup should be a species or group of species that diverged early in the lineage being studied. It’s typically chosen because it lacks most or all of the derived traits present in the other species being compared.
Can cladograms be drawn incorrectly?

+
Yes, cladograms can be incorrectly constructed if the wrong traits are chosen, or if the relationships are not based on shared derived characters. Additionally, if the outgroup is not properly selected, the entire tree’s interpretation can be off.